Dashboard
Opening a profile shows its Overview dashboard. Choose the period (7, 30, 90 or 365 days) and click Refresh to reload it; the tooltip of the button tells when the data was read. Each widget loads as soon as its own data arrives, and if a widget’s data cannot be read you can retry that widget alone.
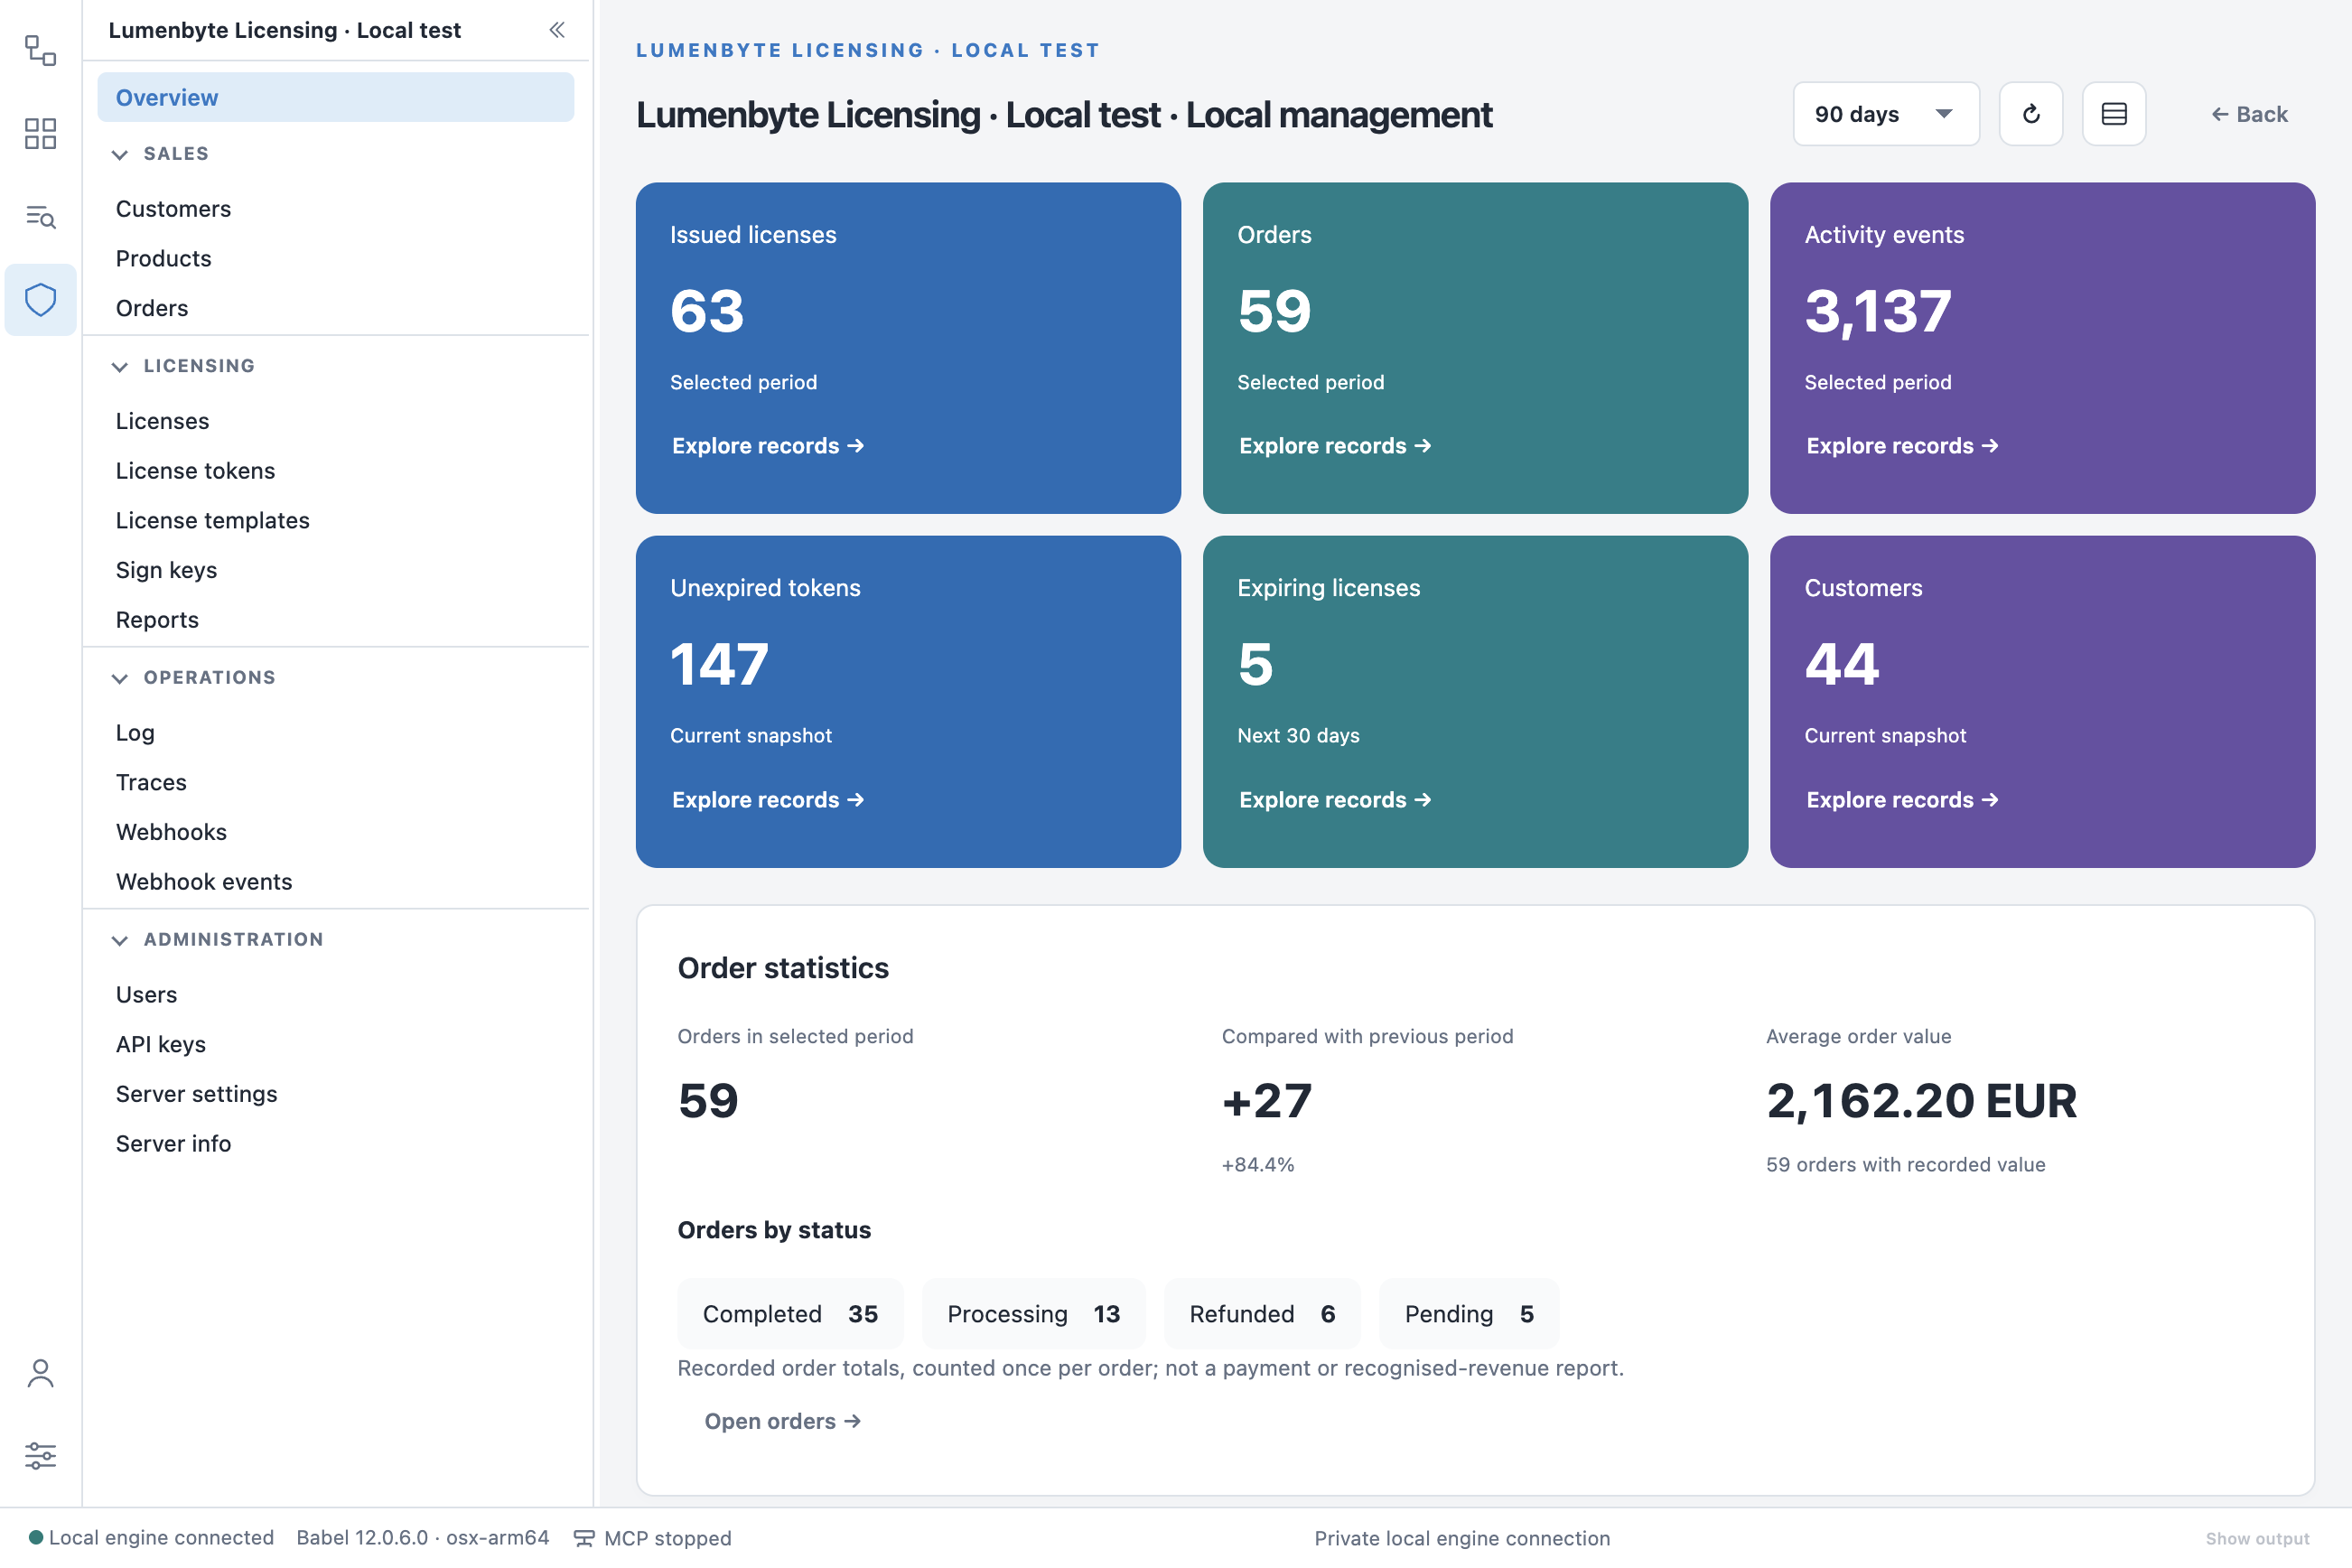
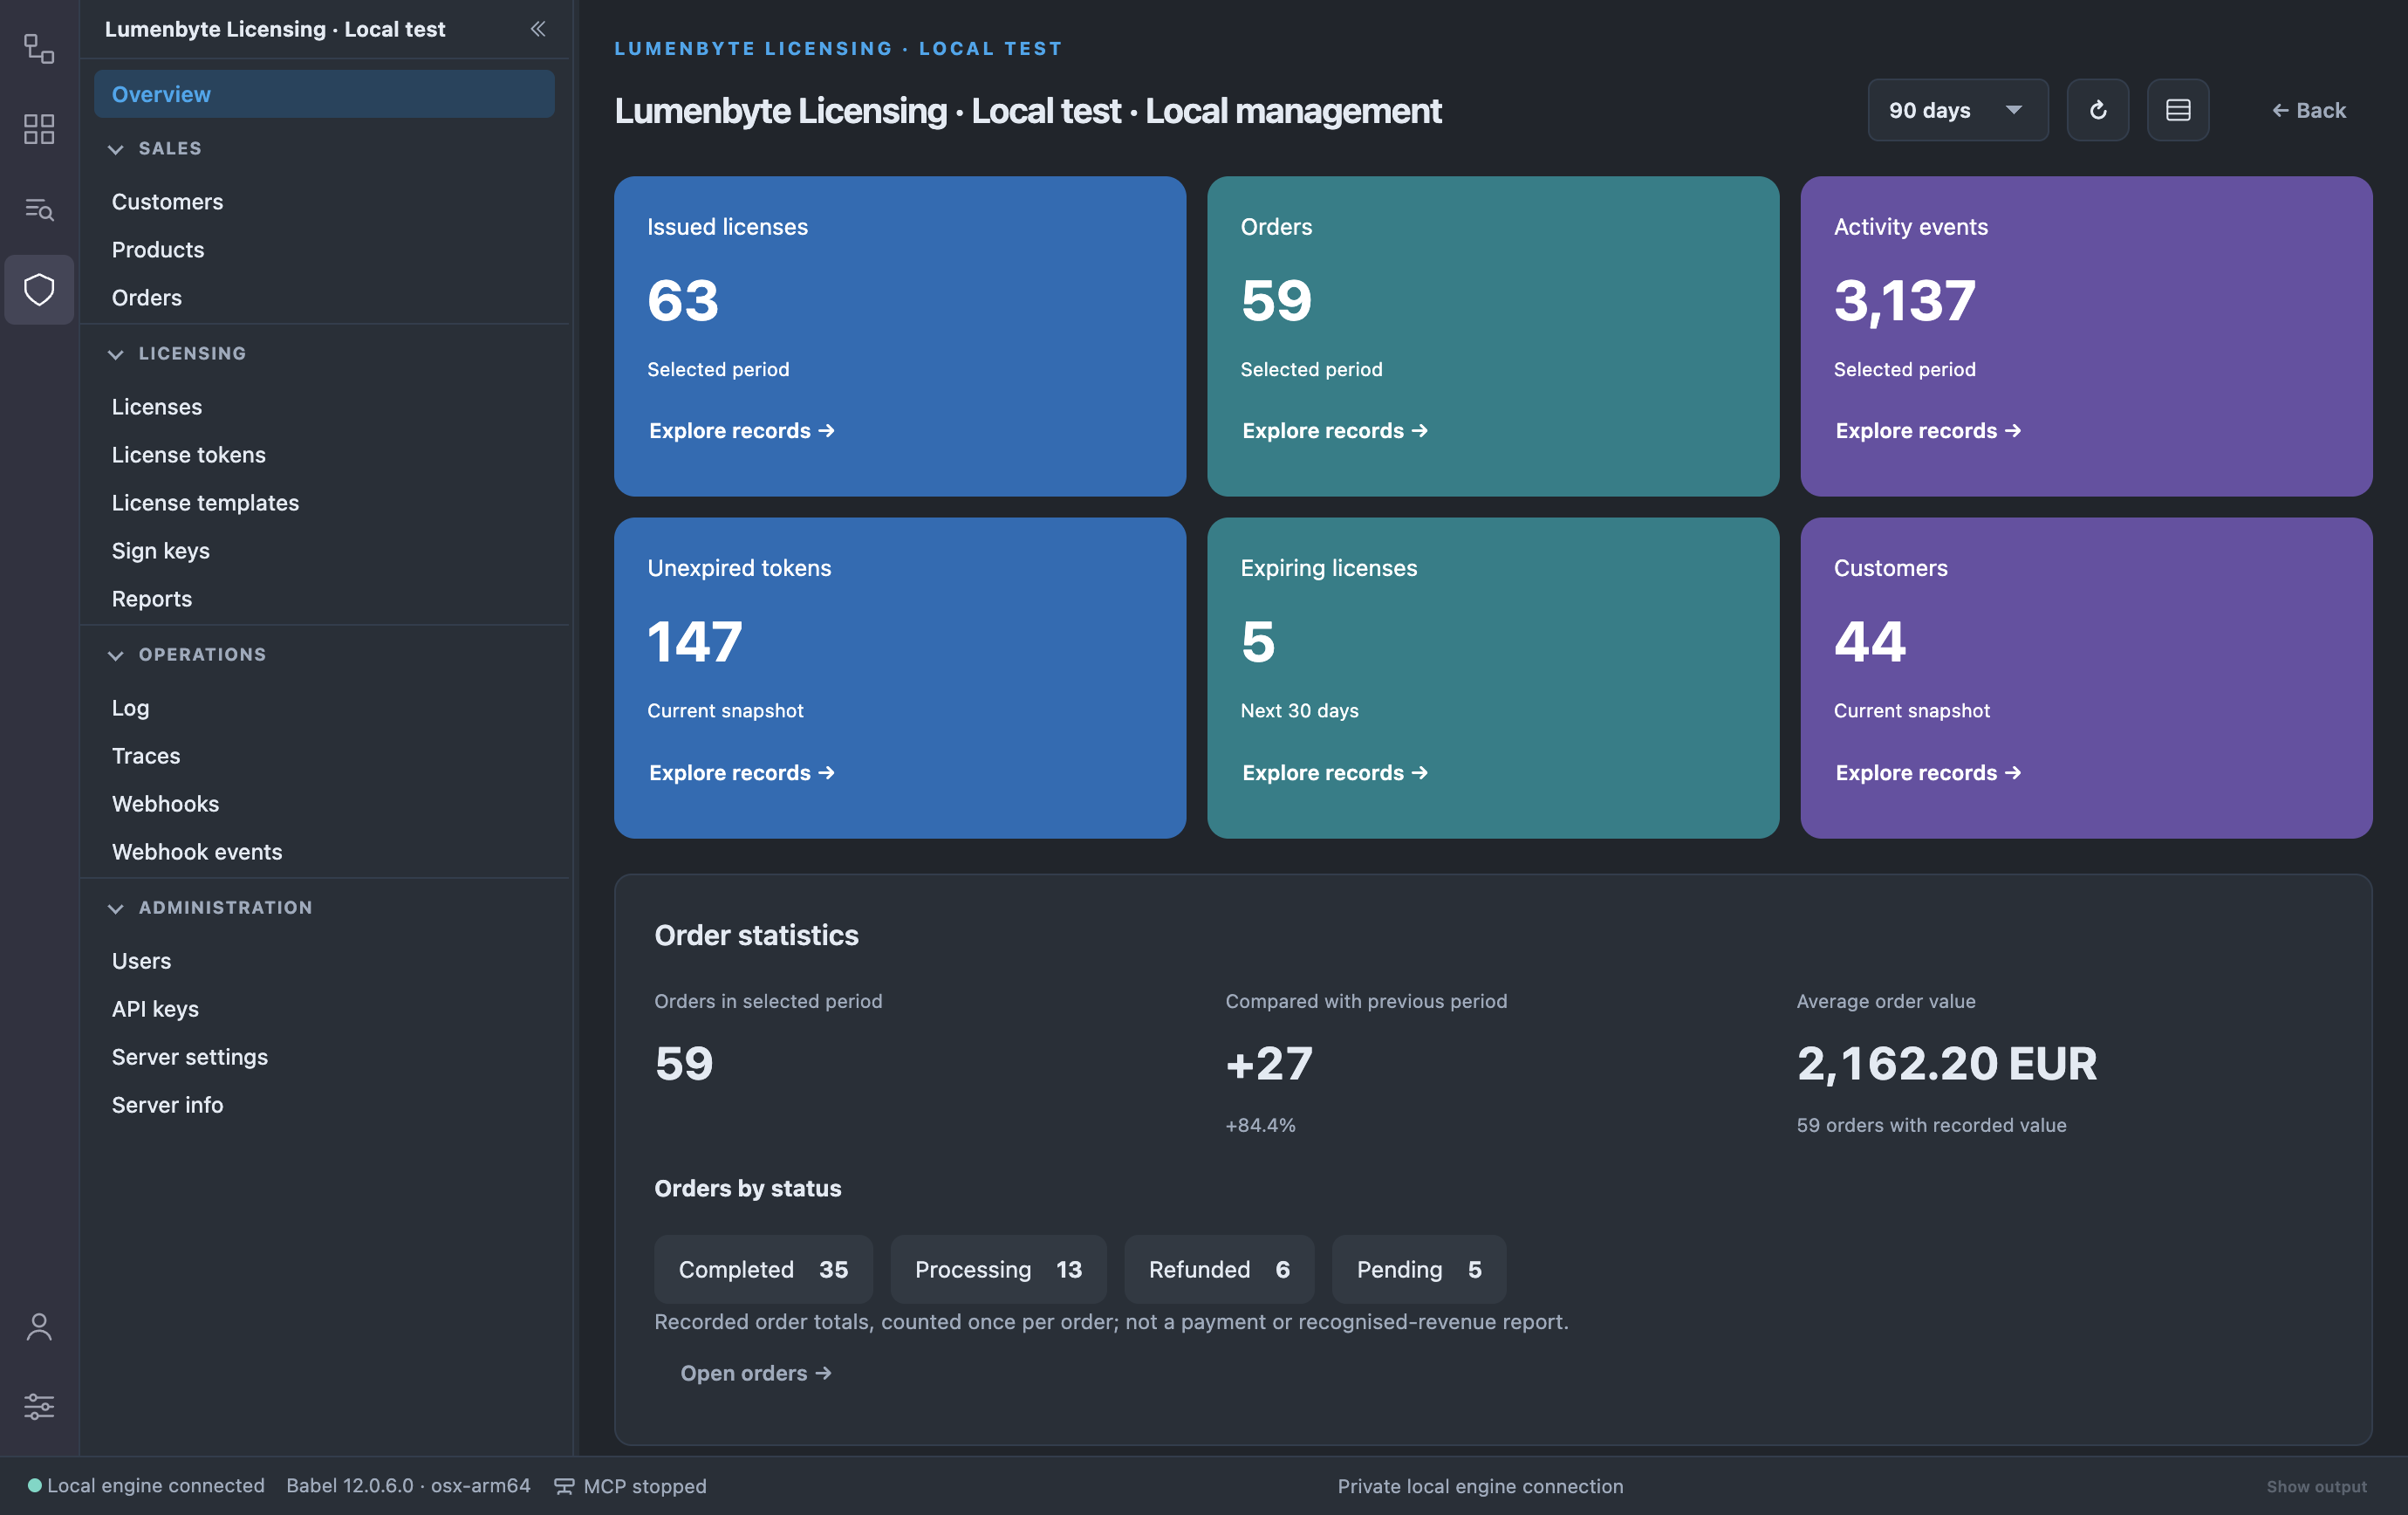
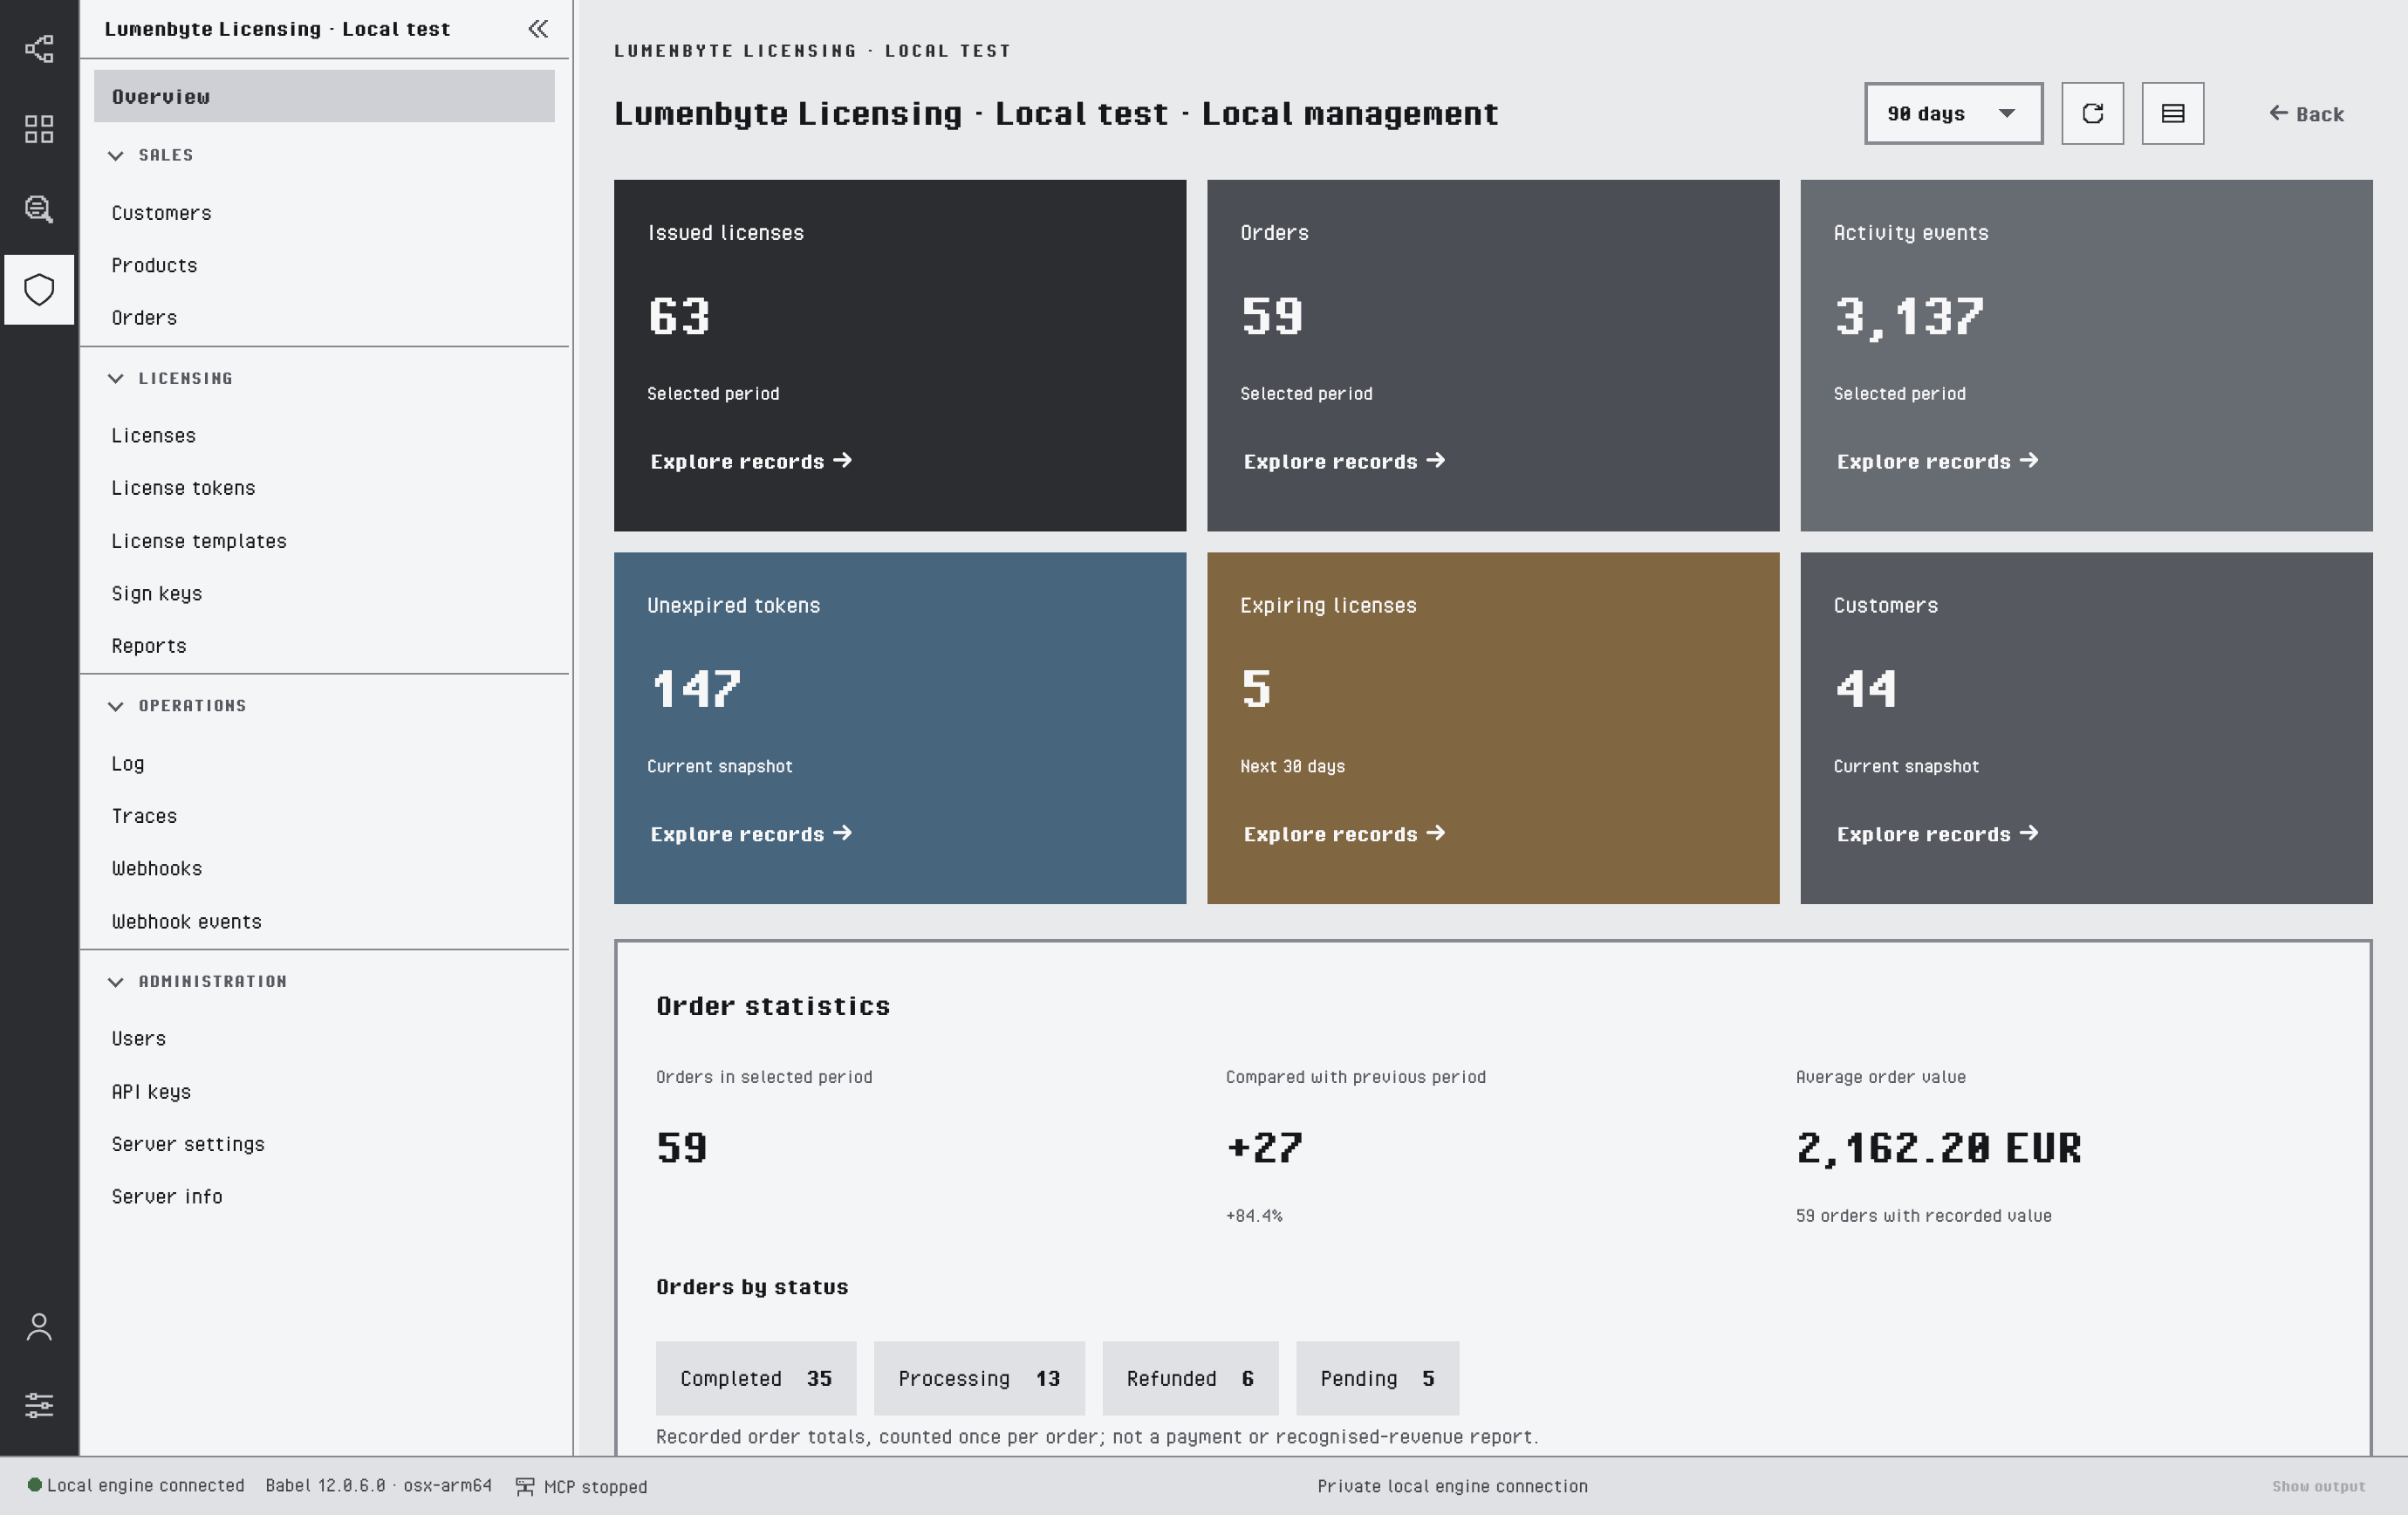
The Overview dashboard
The dashboard has these widgets:
- Tiles: issued licenses, orders, activity events, unexpired tokens, licenses expiring in the next 30 days and customers. Explore records on a tile opens the matching records for the same period.
- Order statistics: the order count compared with the previous period, the average order value per currency and the orders by status. Amounts in different currencies are never added together.
- Geographic activity: the activity globe described below.
- Activity over time, Licenses by product and Licensing modes (File, Activation, Floating) charts.
- Reports: the diagnostic reports received in the period, by type.
- Log: a histogram of the service log entries by level.
- Recent activity: the latest license events, without the client they came from.
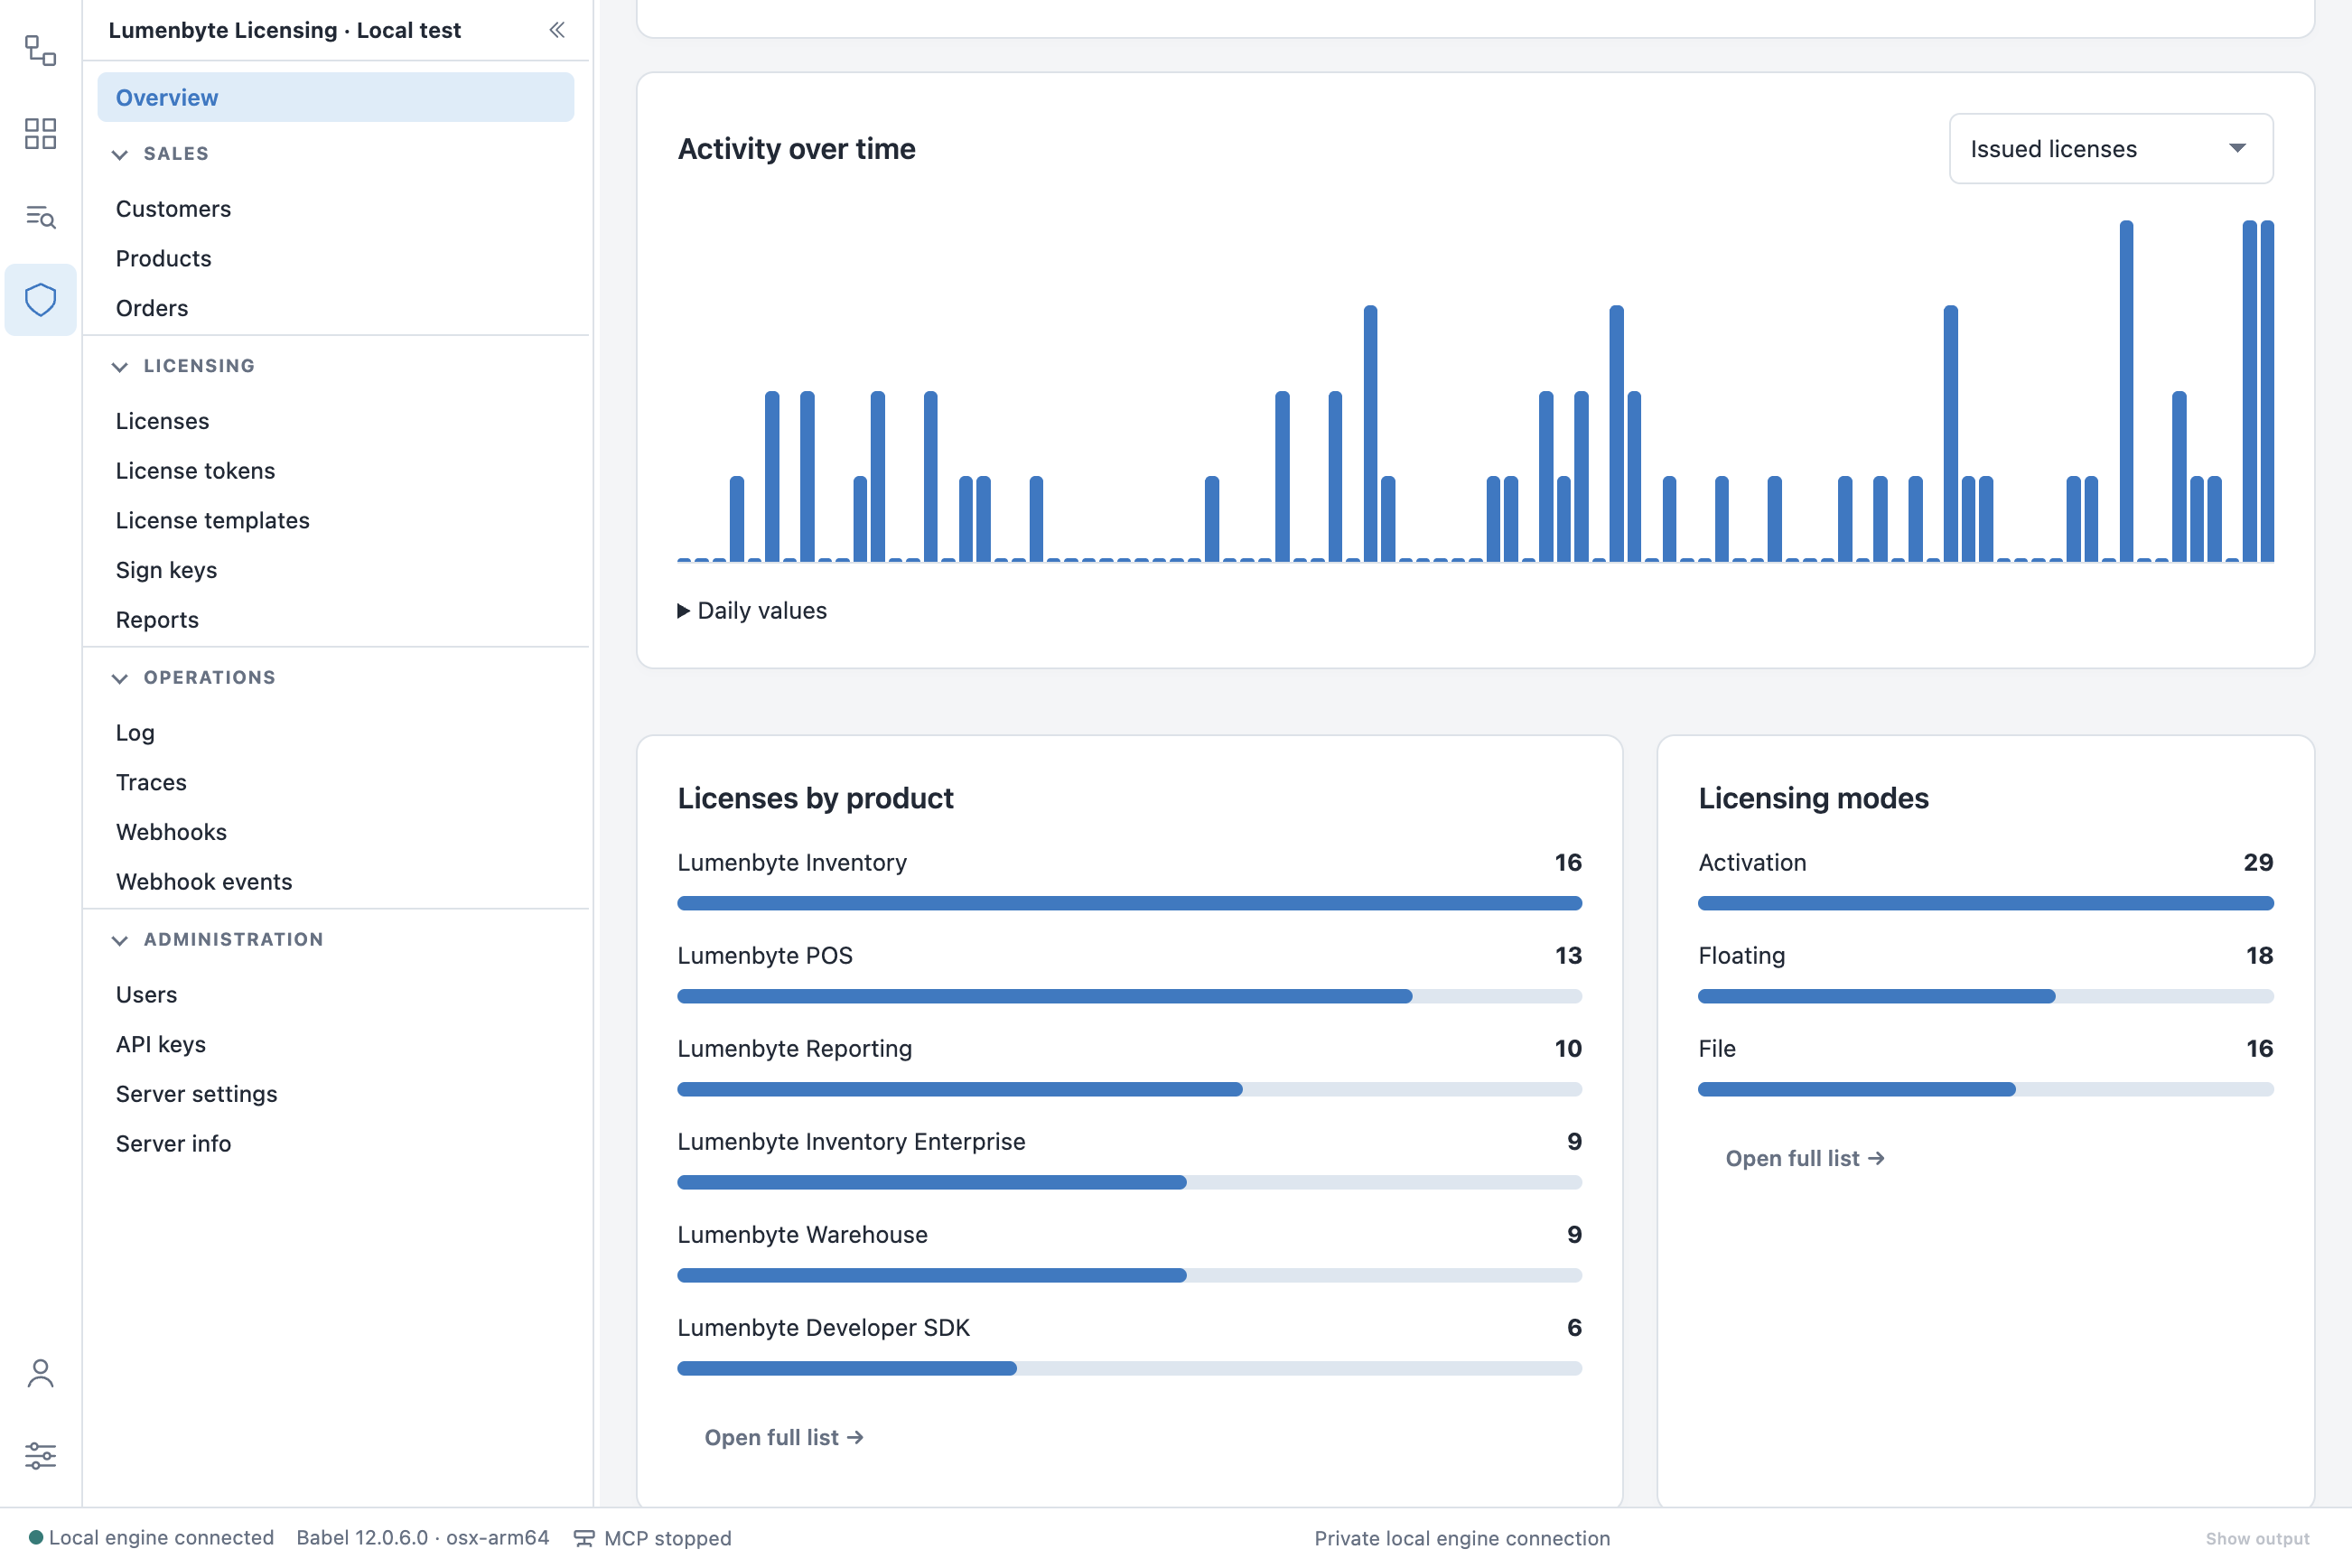
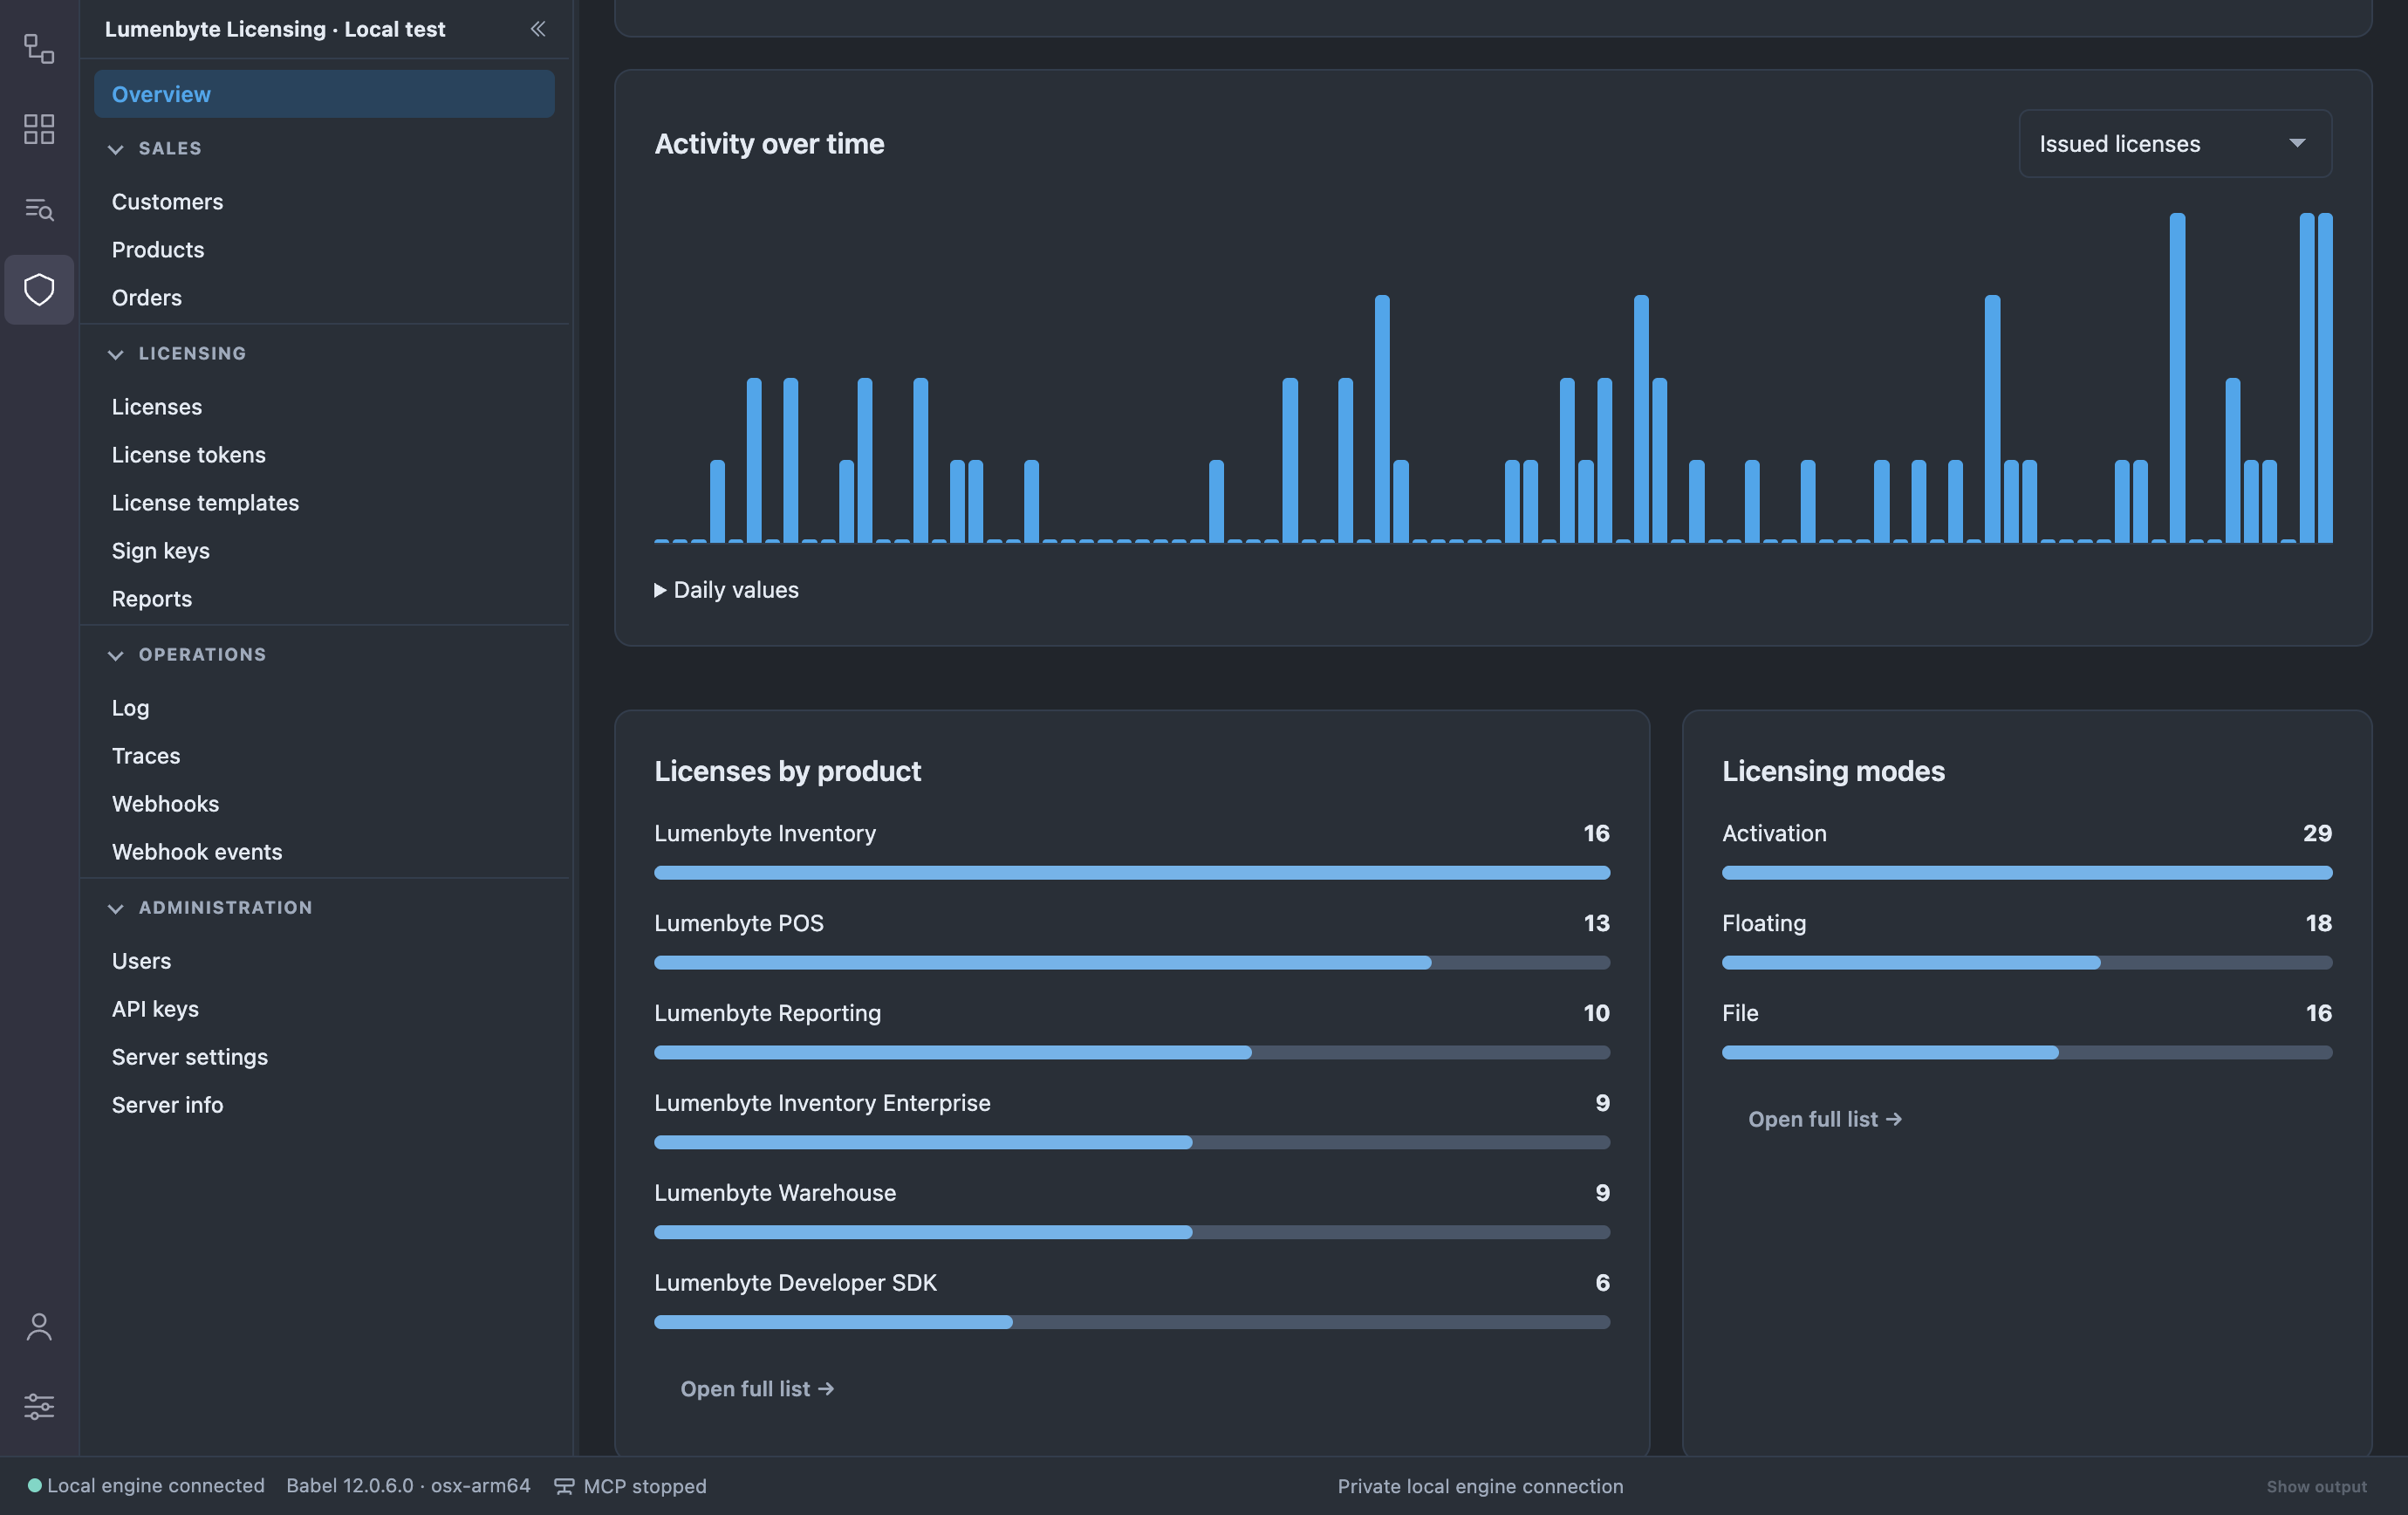
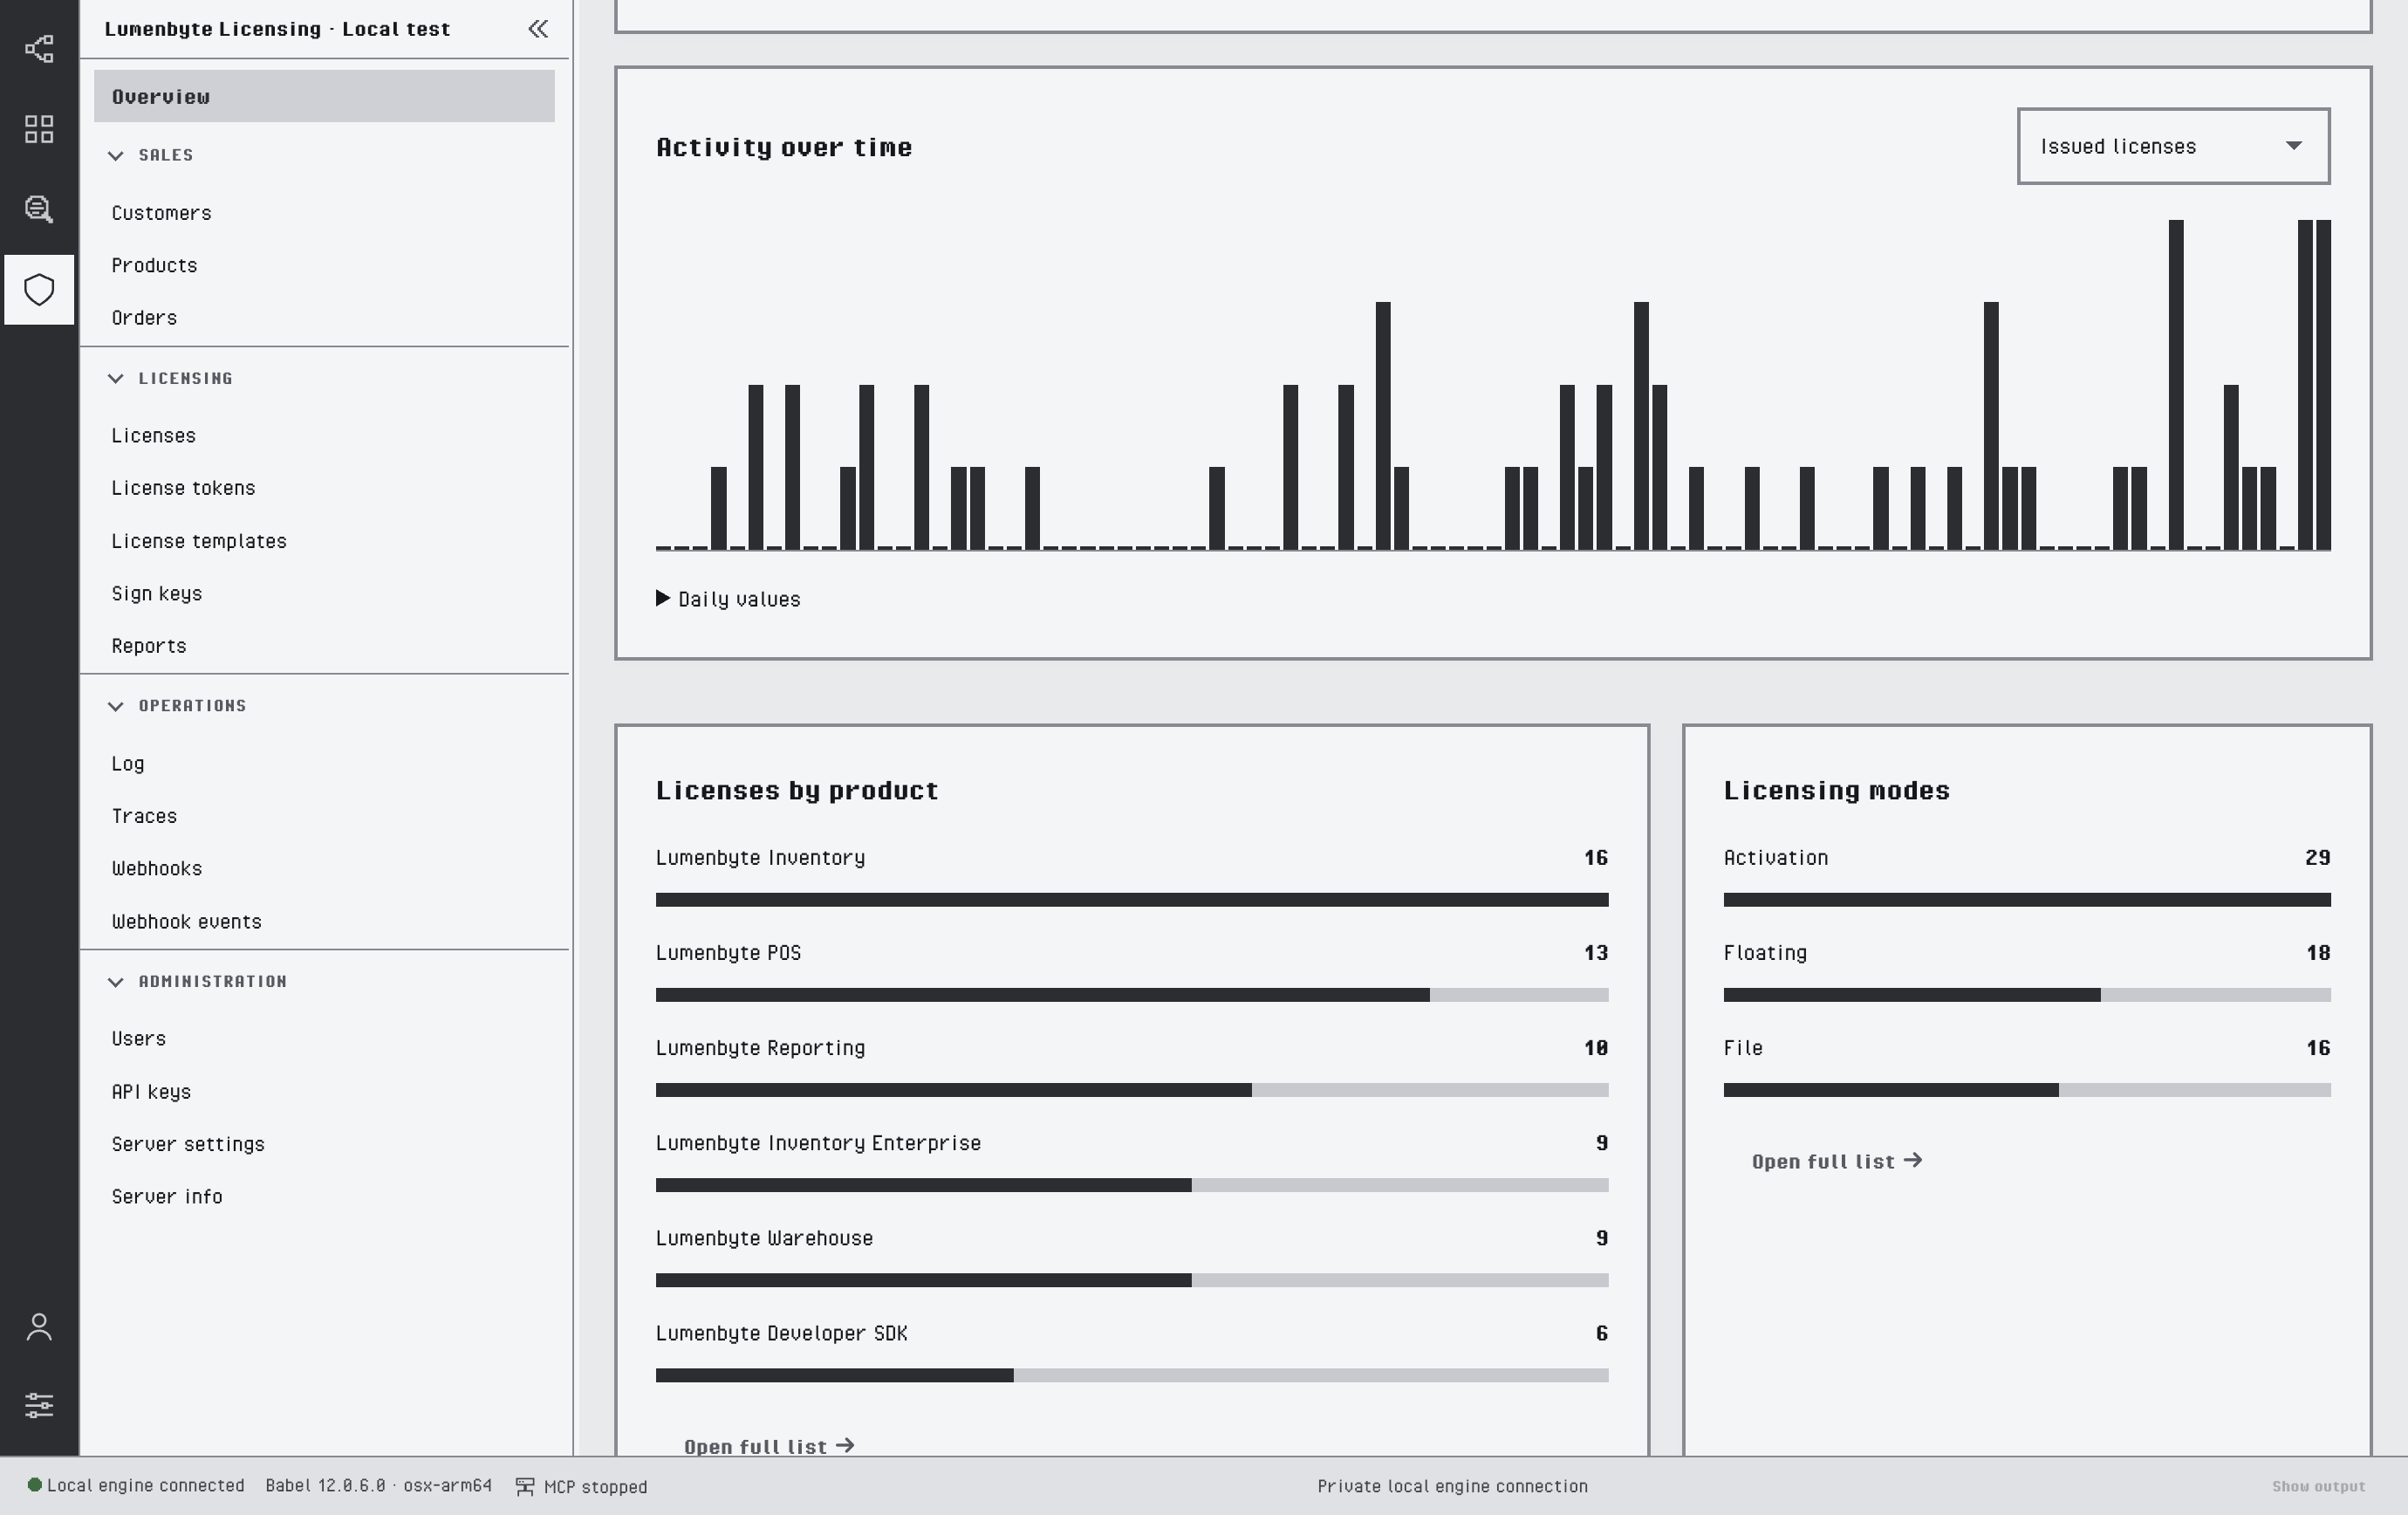
Activity, product and licensing mode charts
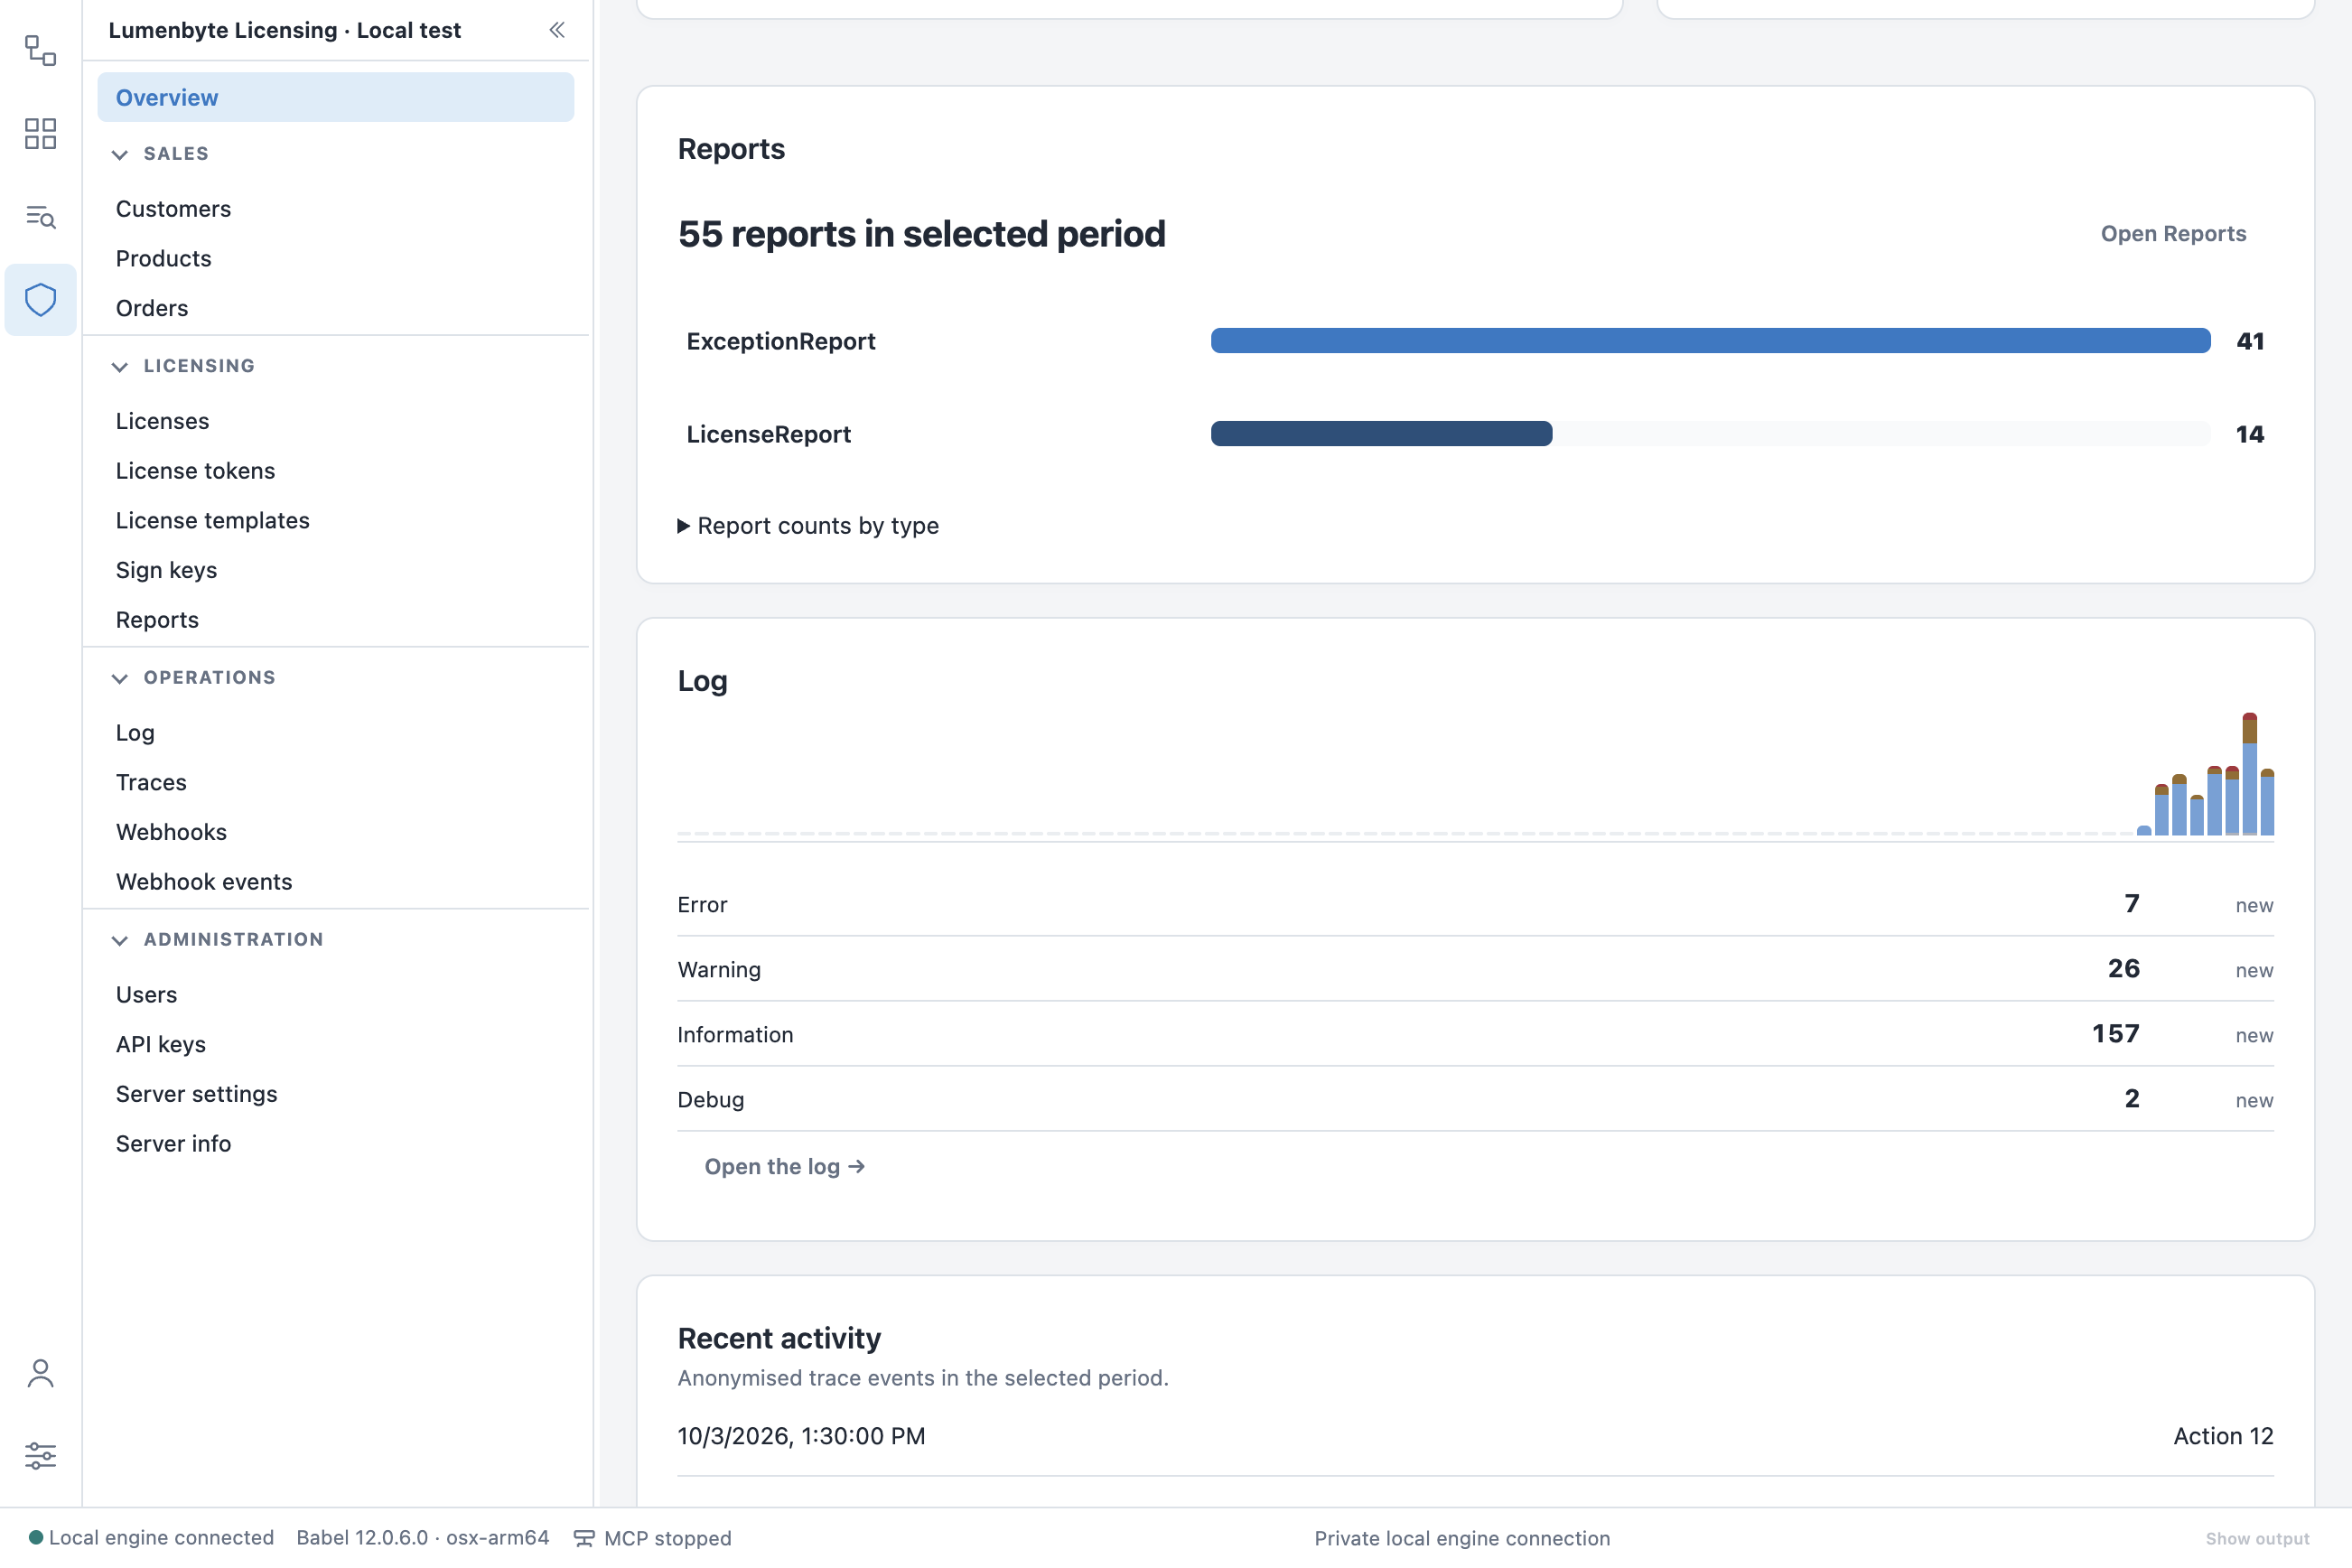
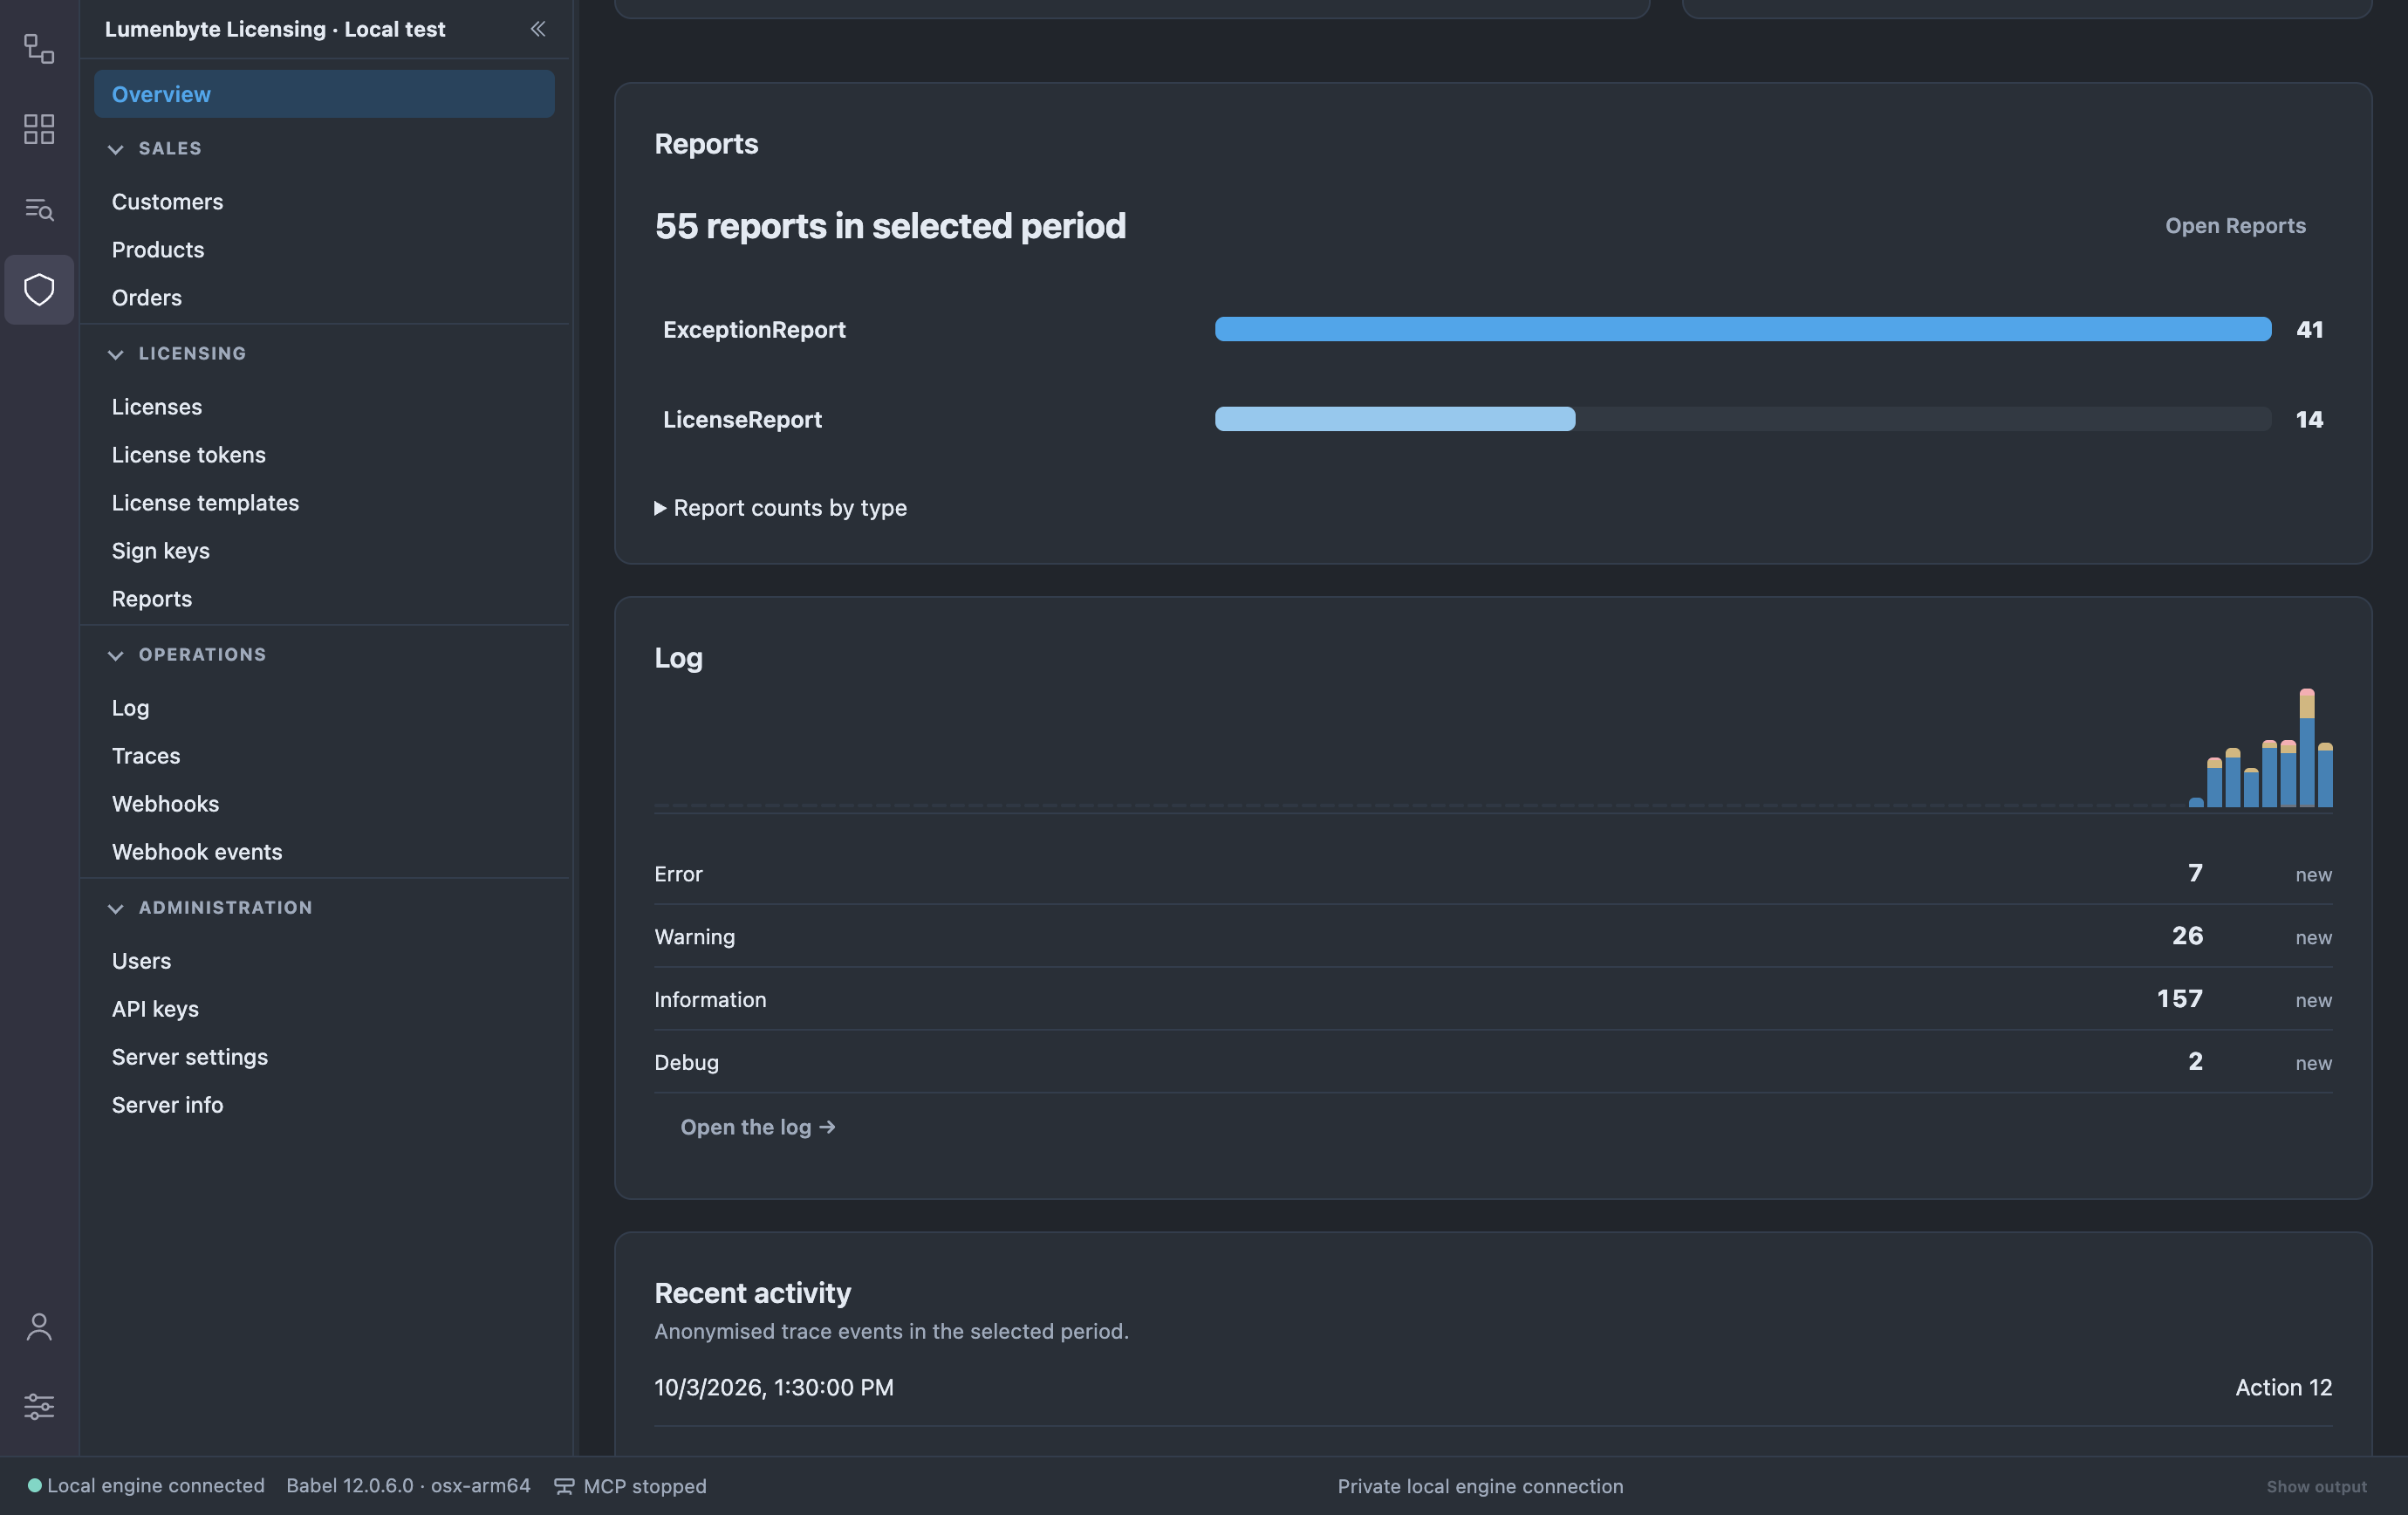
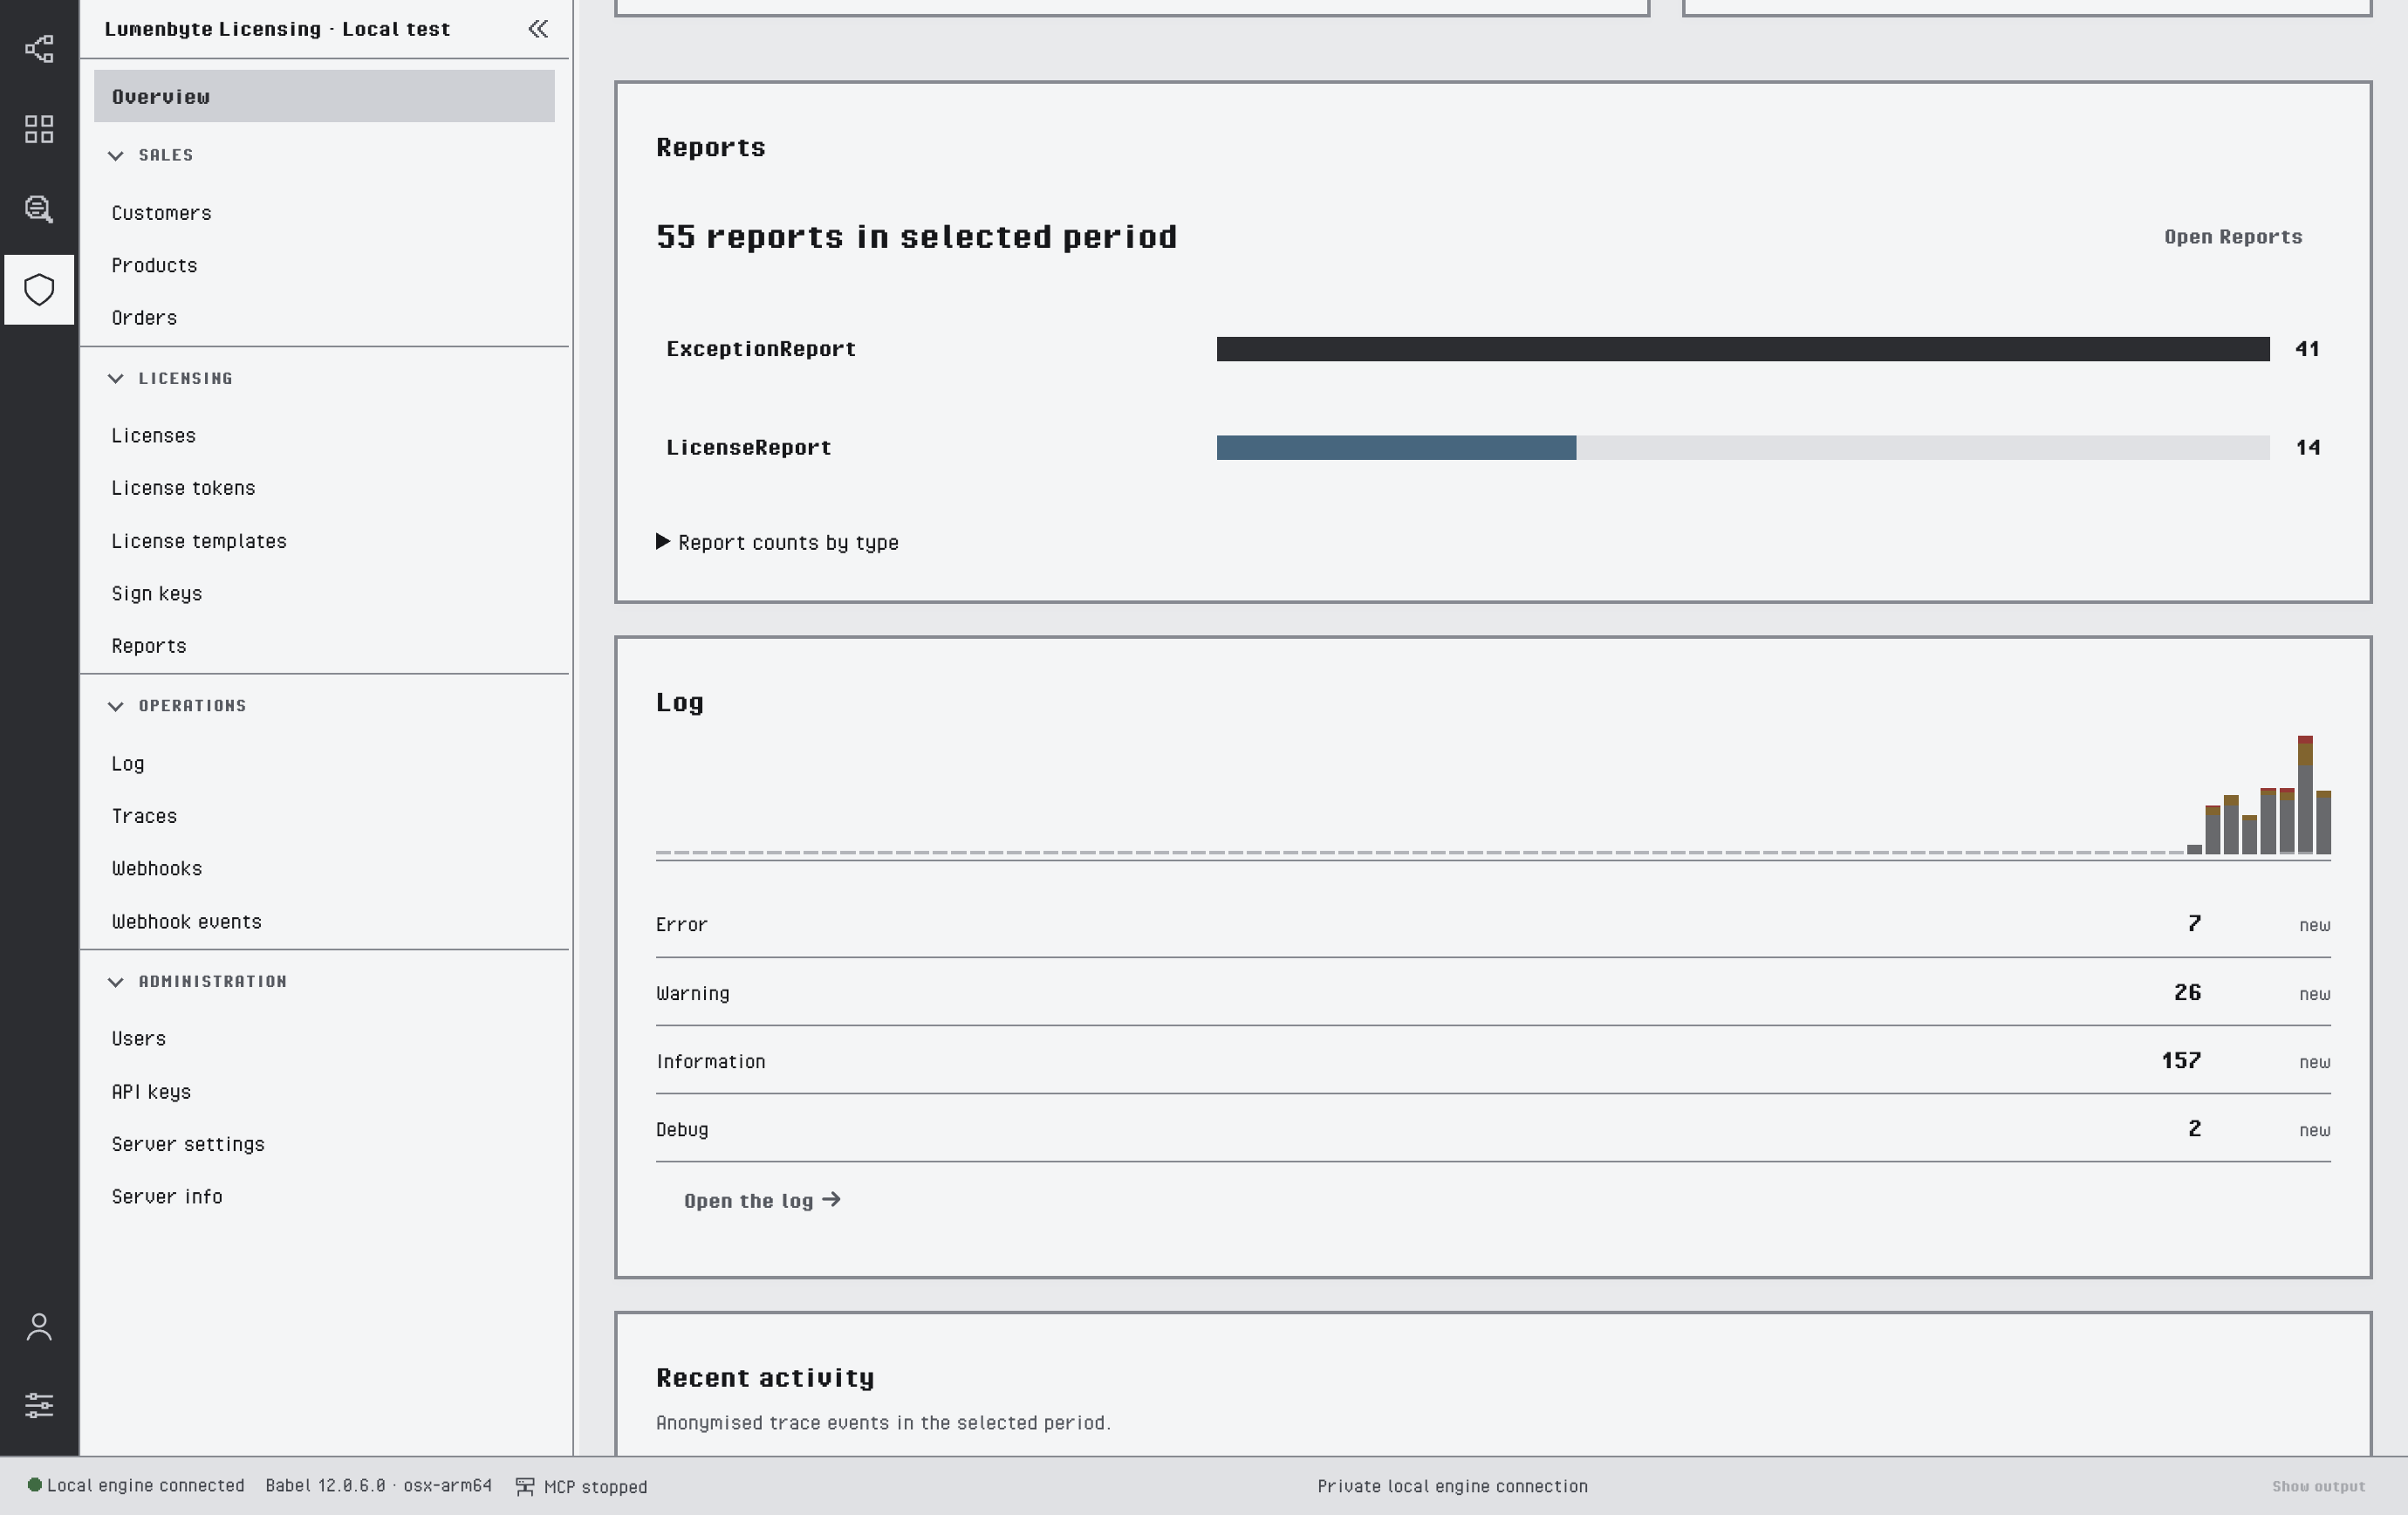
Reports, log and recent activity widgets
Periods use UTC dates. The dashboard reads at most 10,000 records per dataset and marks a widget as partial when a dataset is larger.
To arrange the dashboard, click Customise. Drag a widget by its handle to move it, or hold Alt and press the up and down arrows, then click Done. The order is remembered.
Geographic Activity
The Geographic activity widget plots licensing activity on a rotating globe, above a Countries and licenses table with the flag, the activity events and the licenses of each country. For a local management profile, countries come from the country of the customer linked to each licensed order; otherwise activity is placed from the locations recorded with license traces. Drag to rotate the globe, use the mouse wheel, pinch or the + and - buttons to zoom, and click a country marker or a table row to open the licenses of that country.
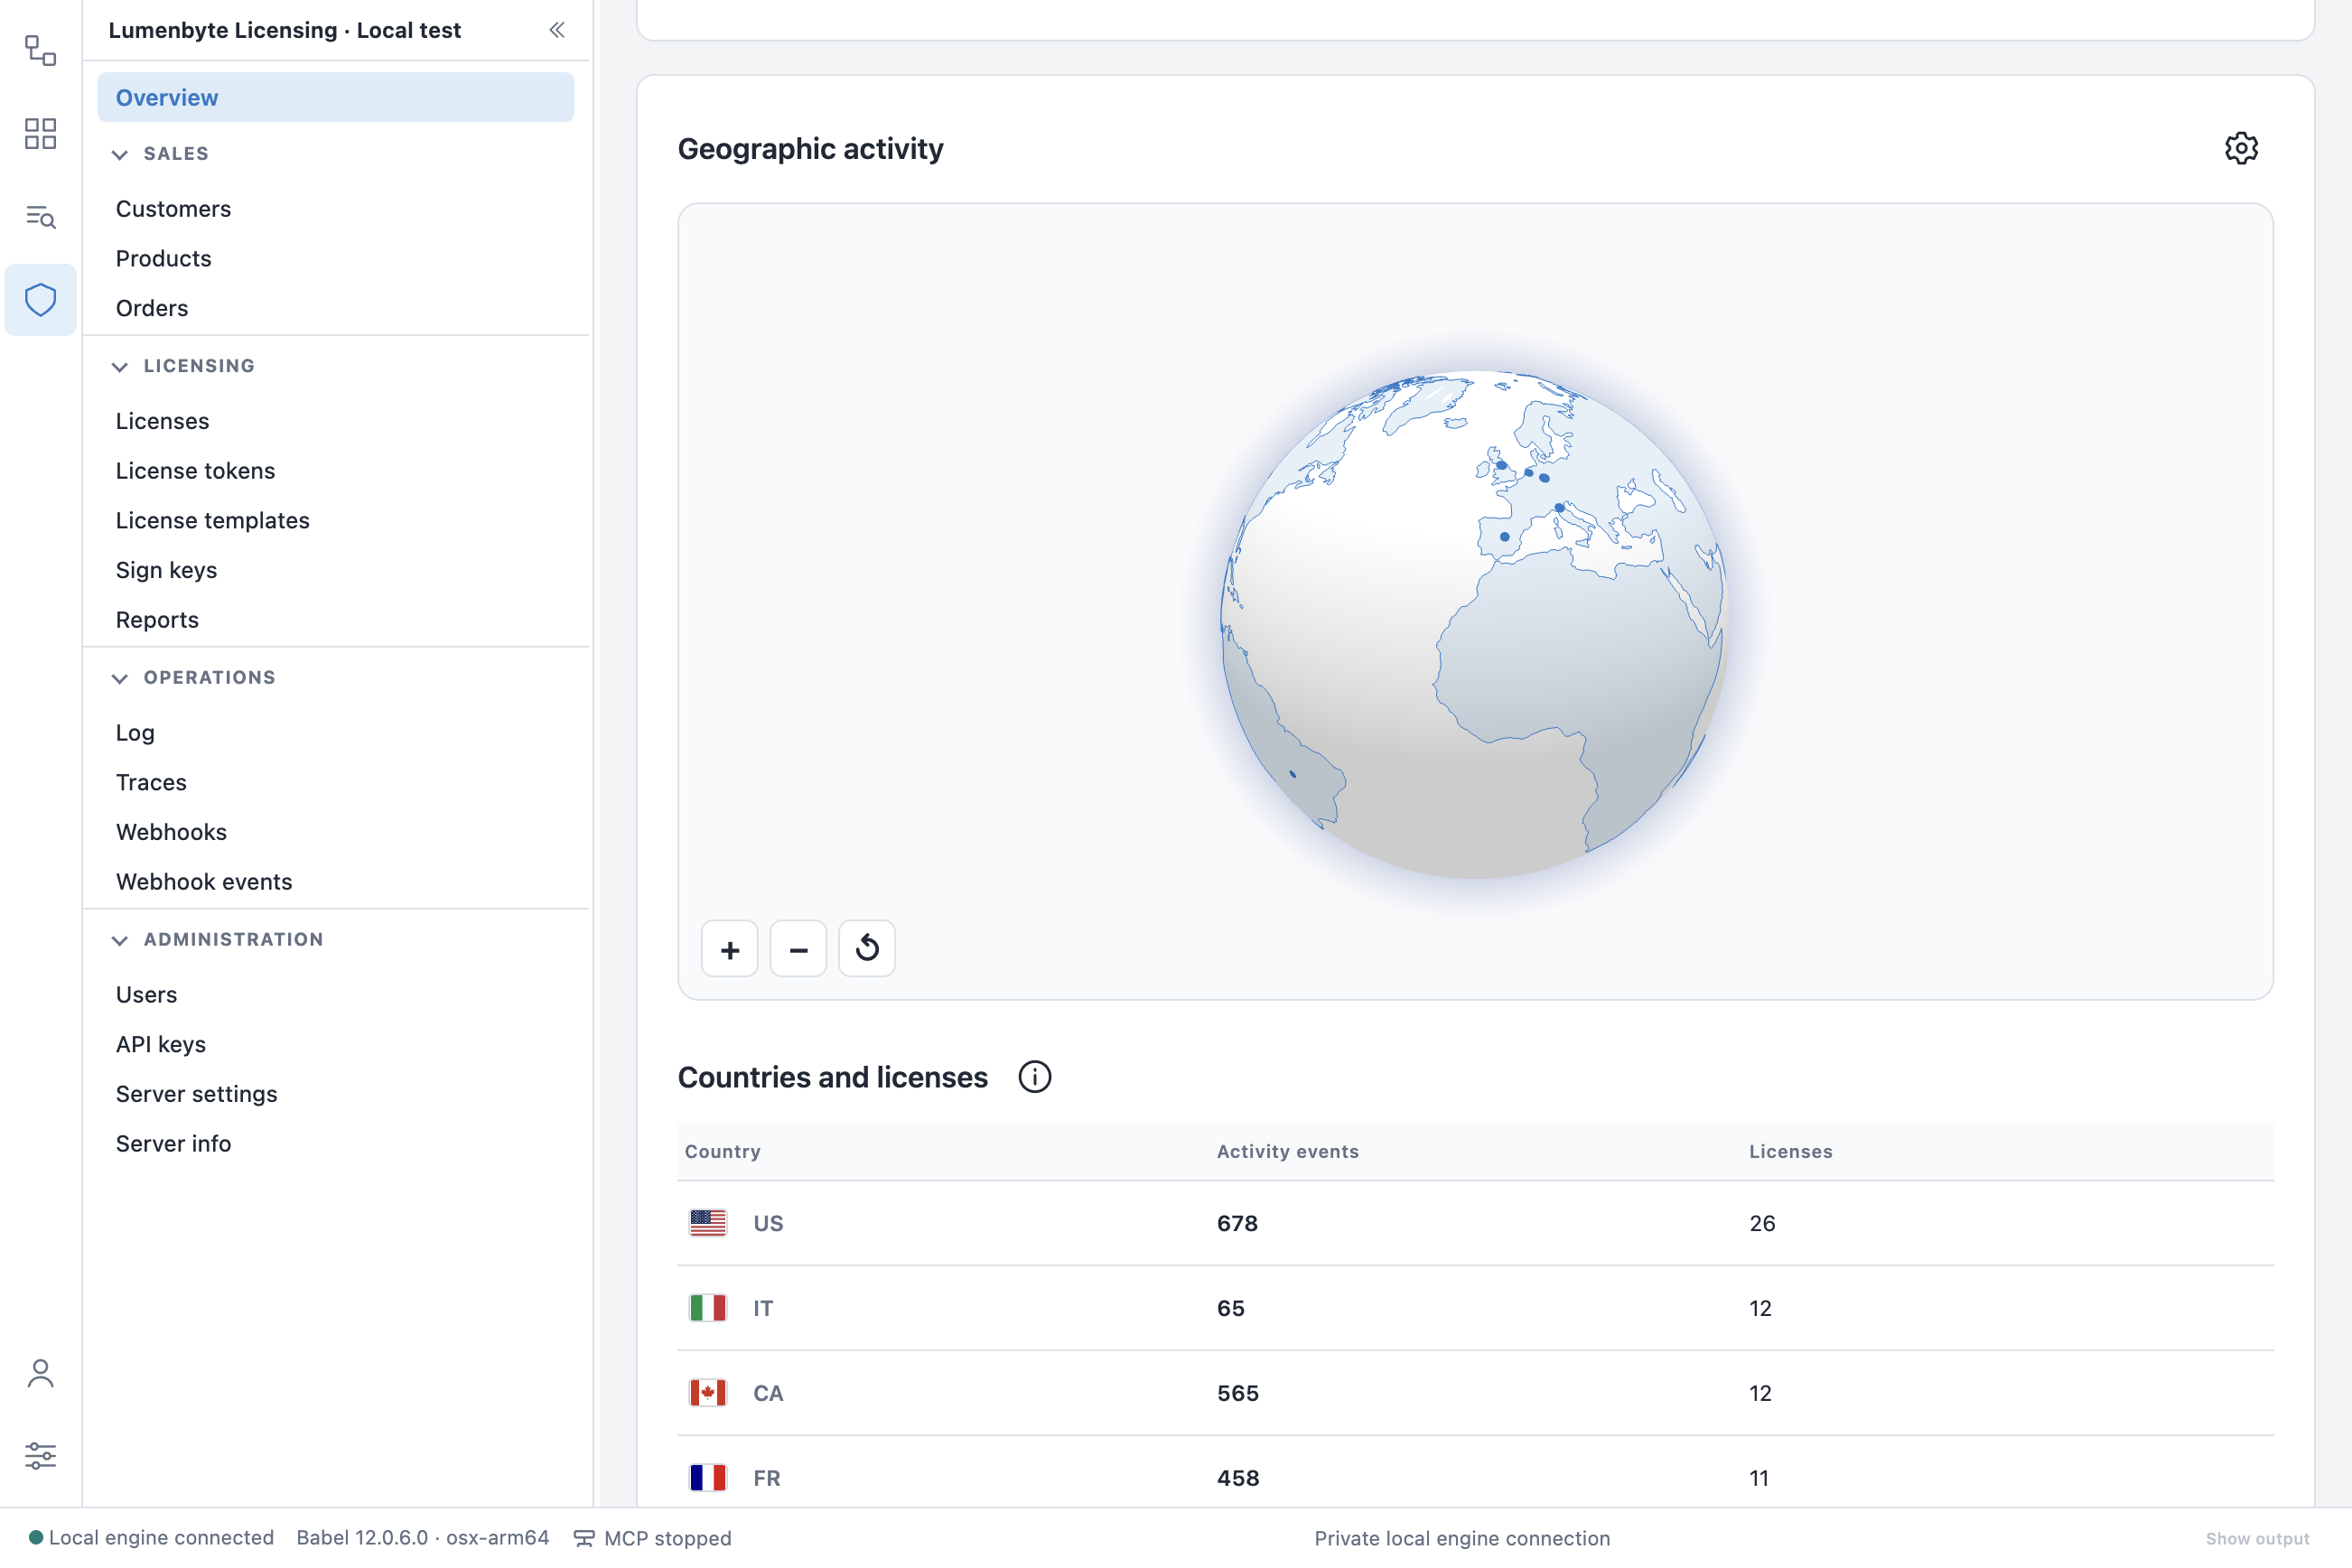
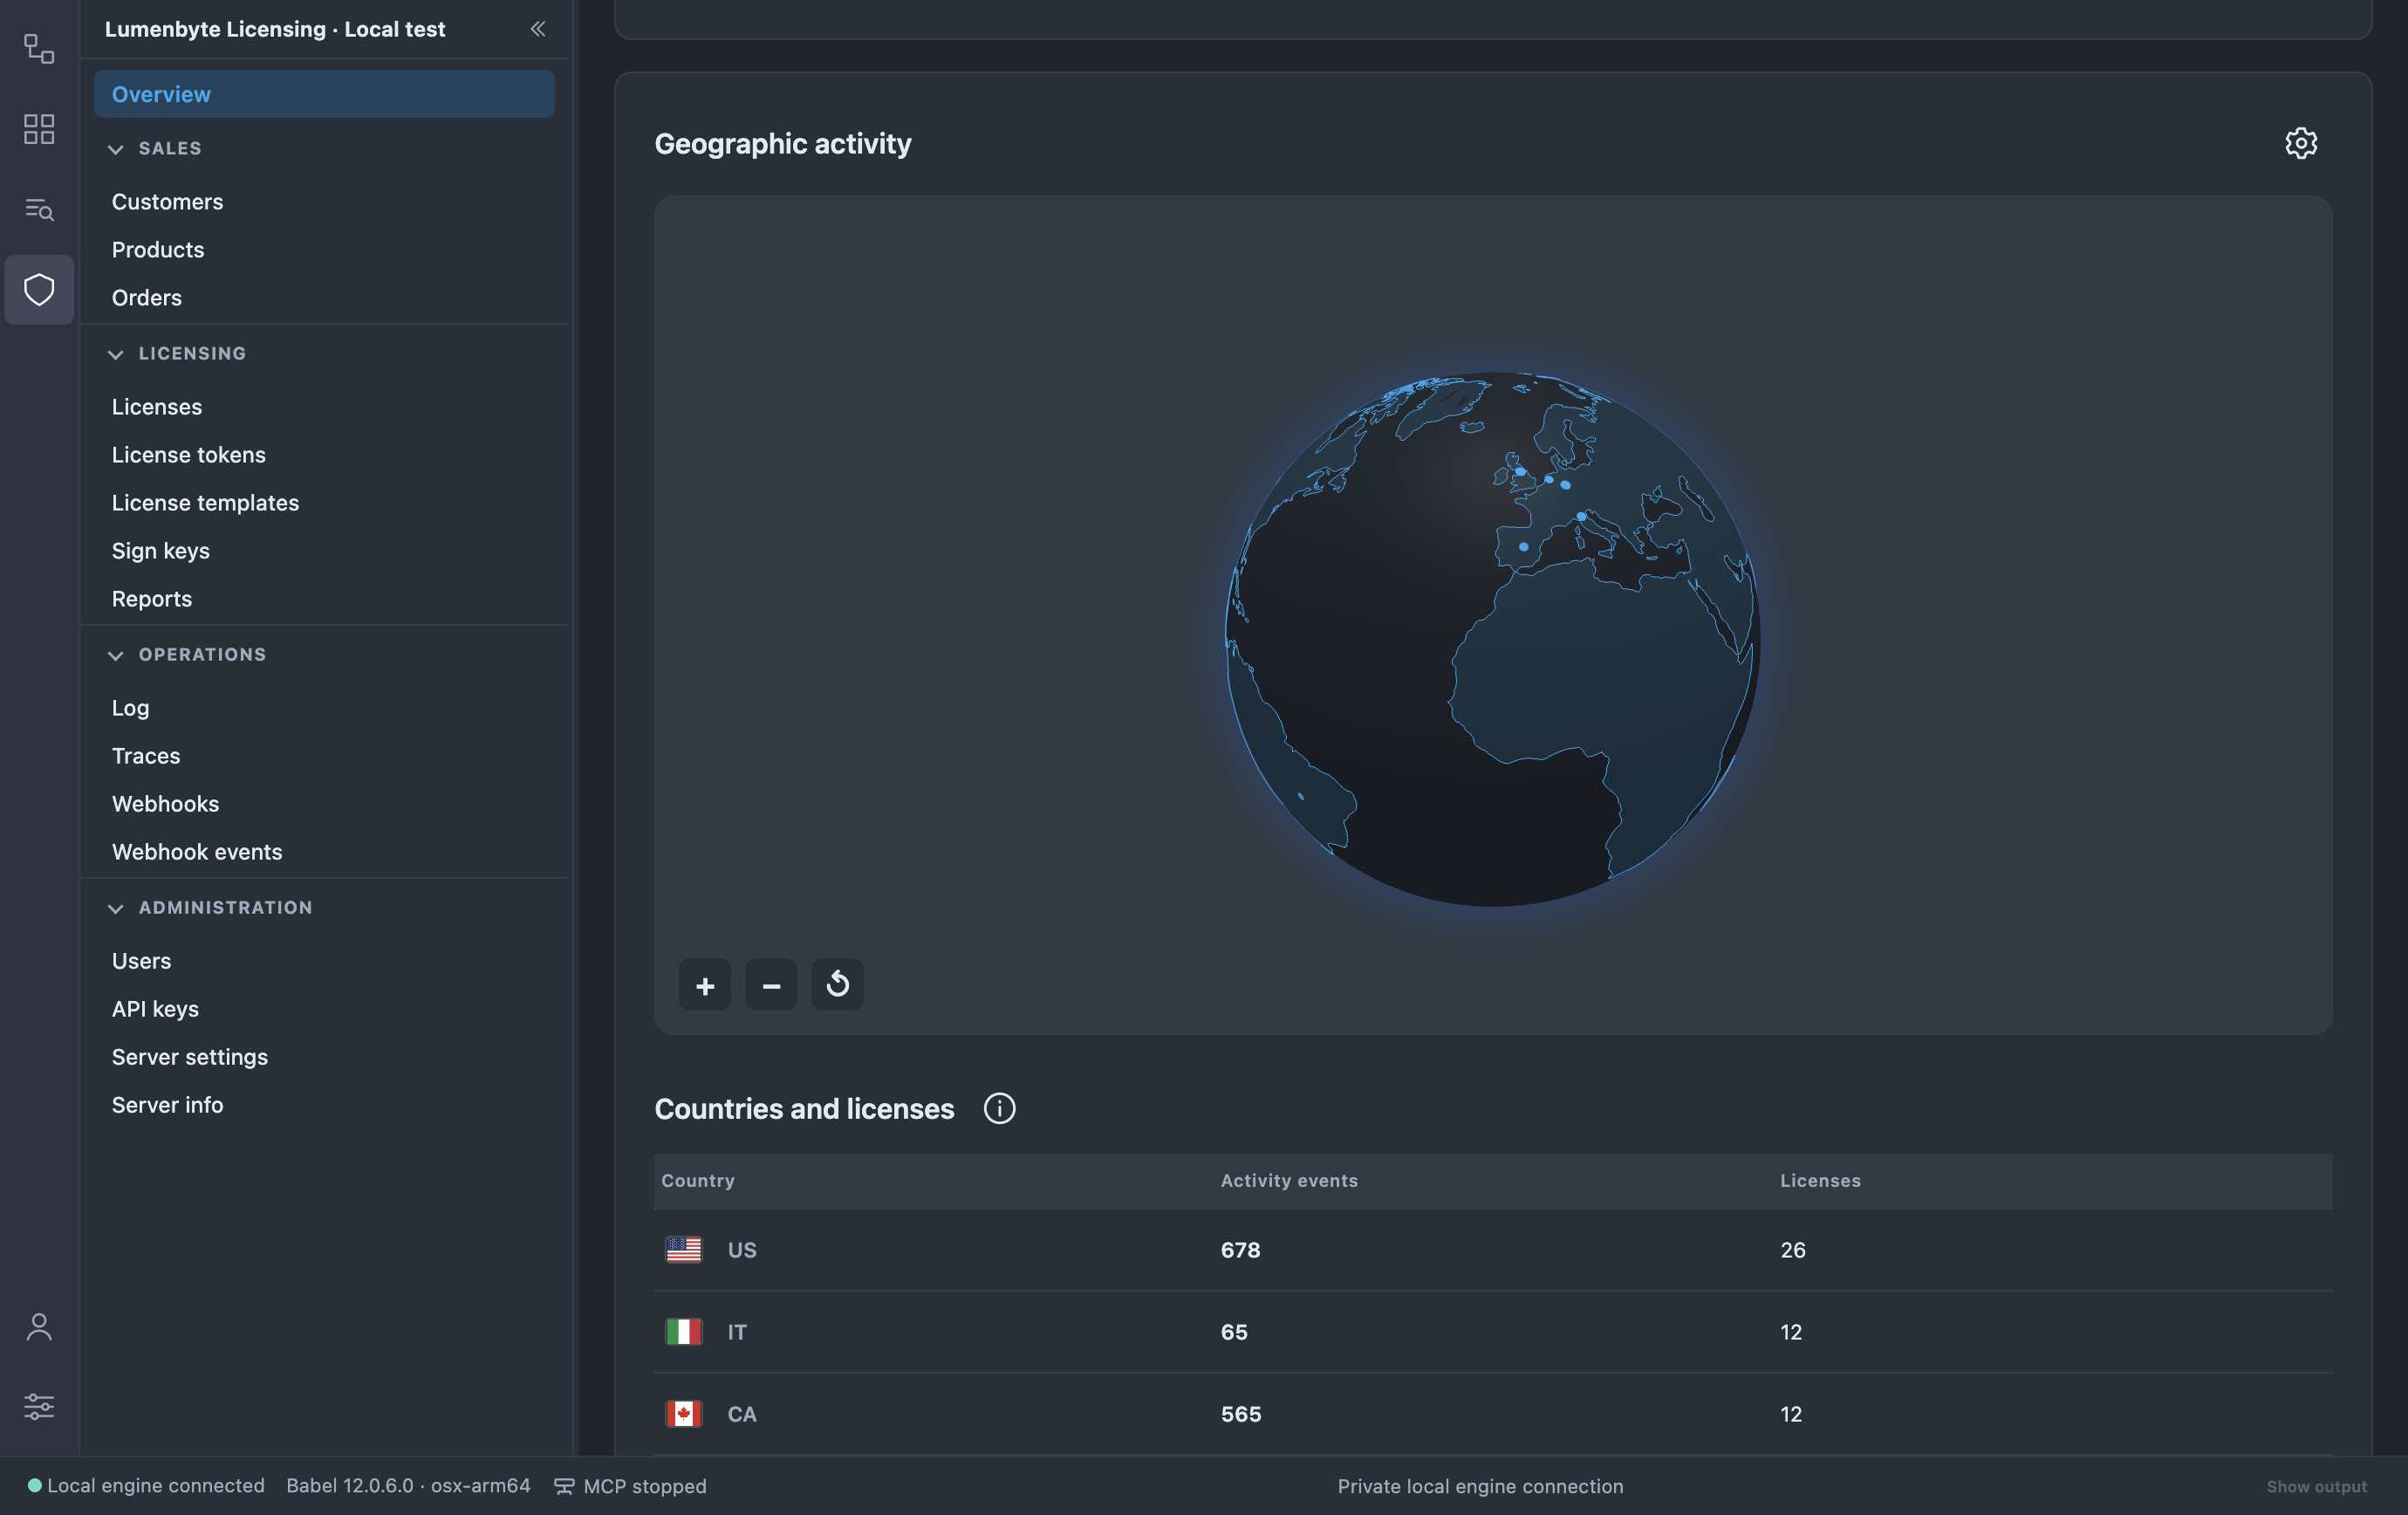
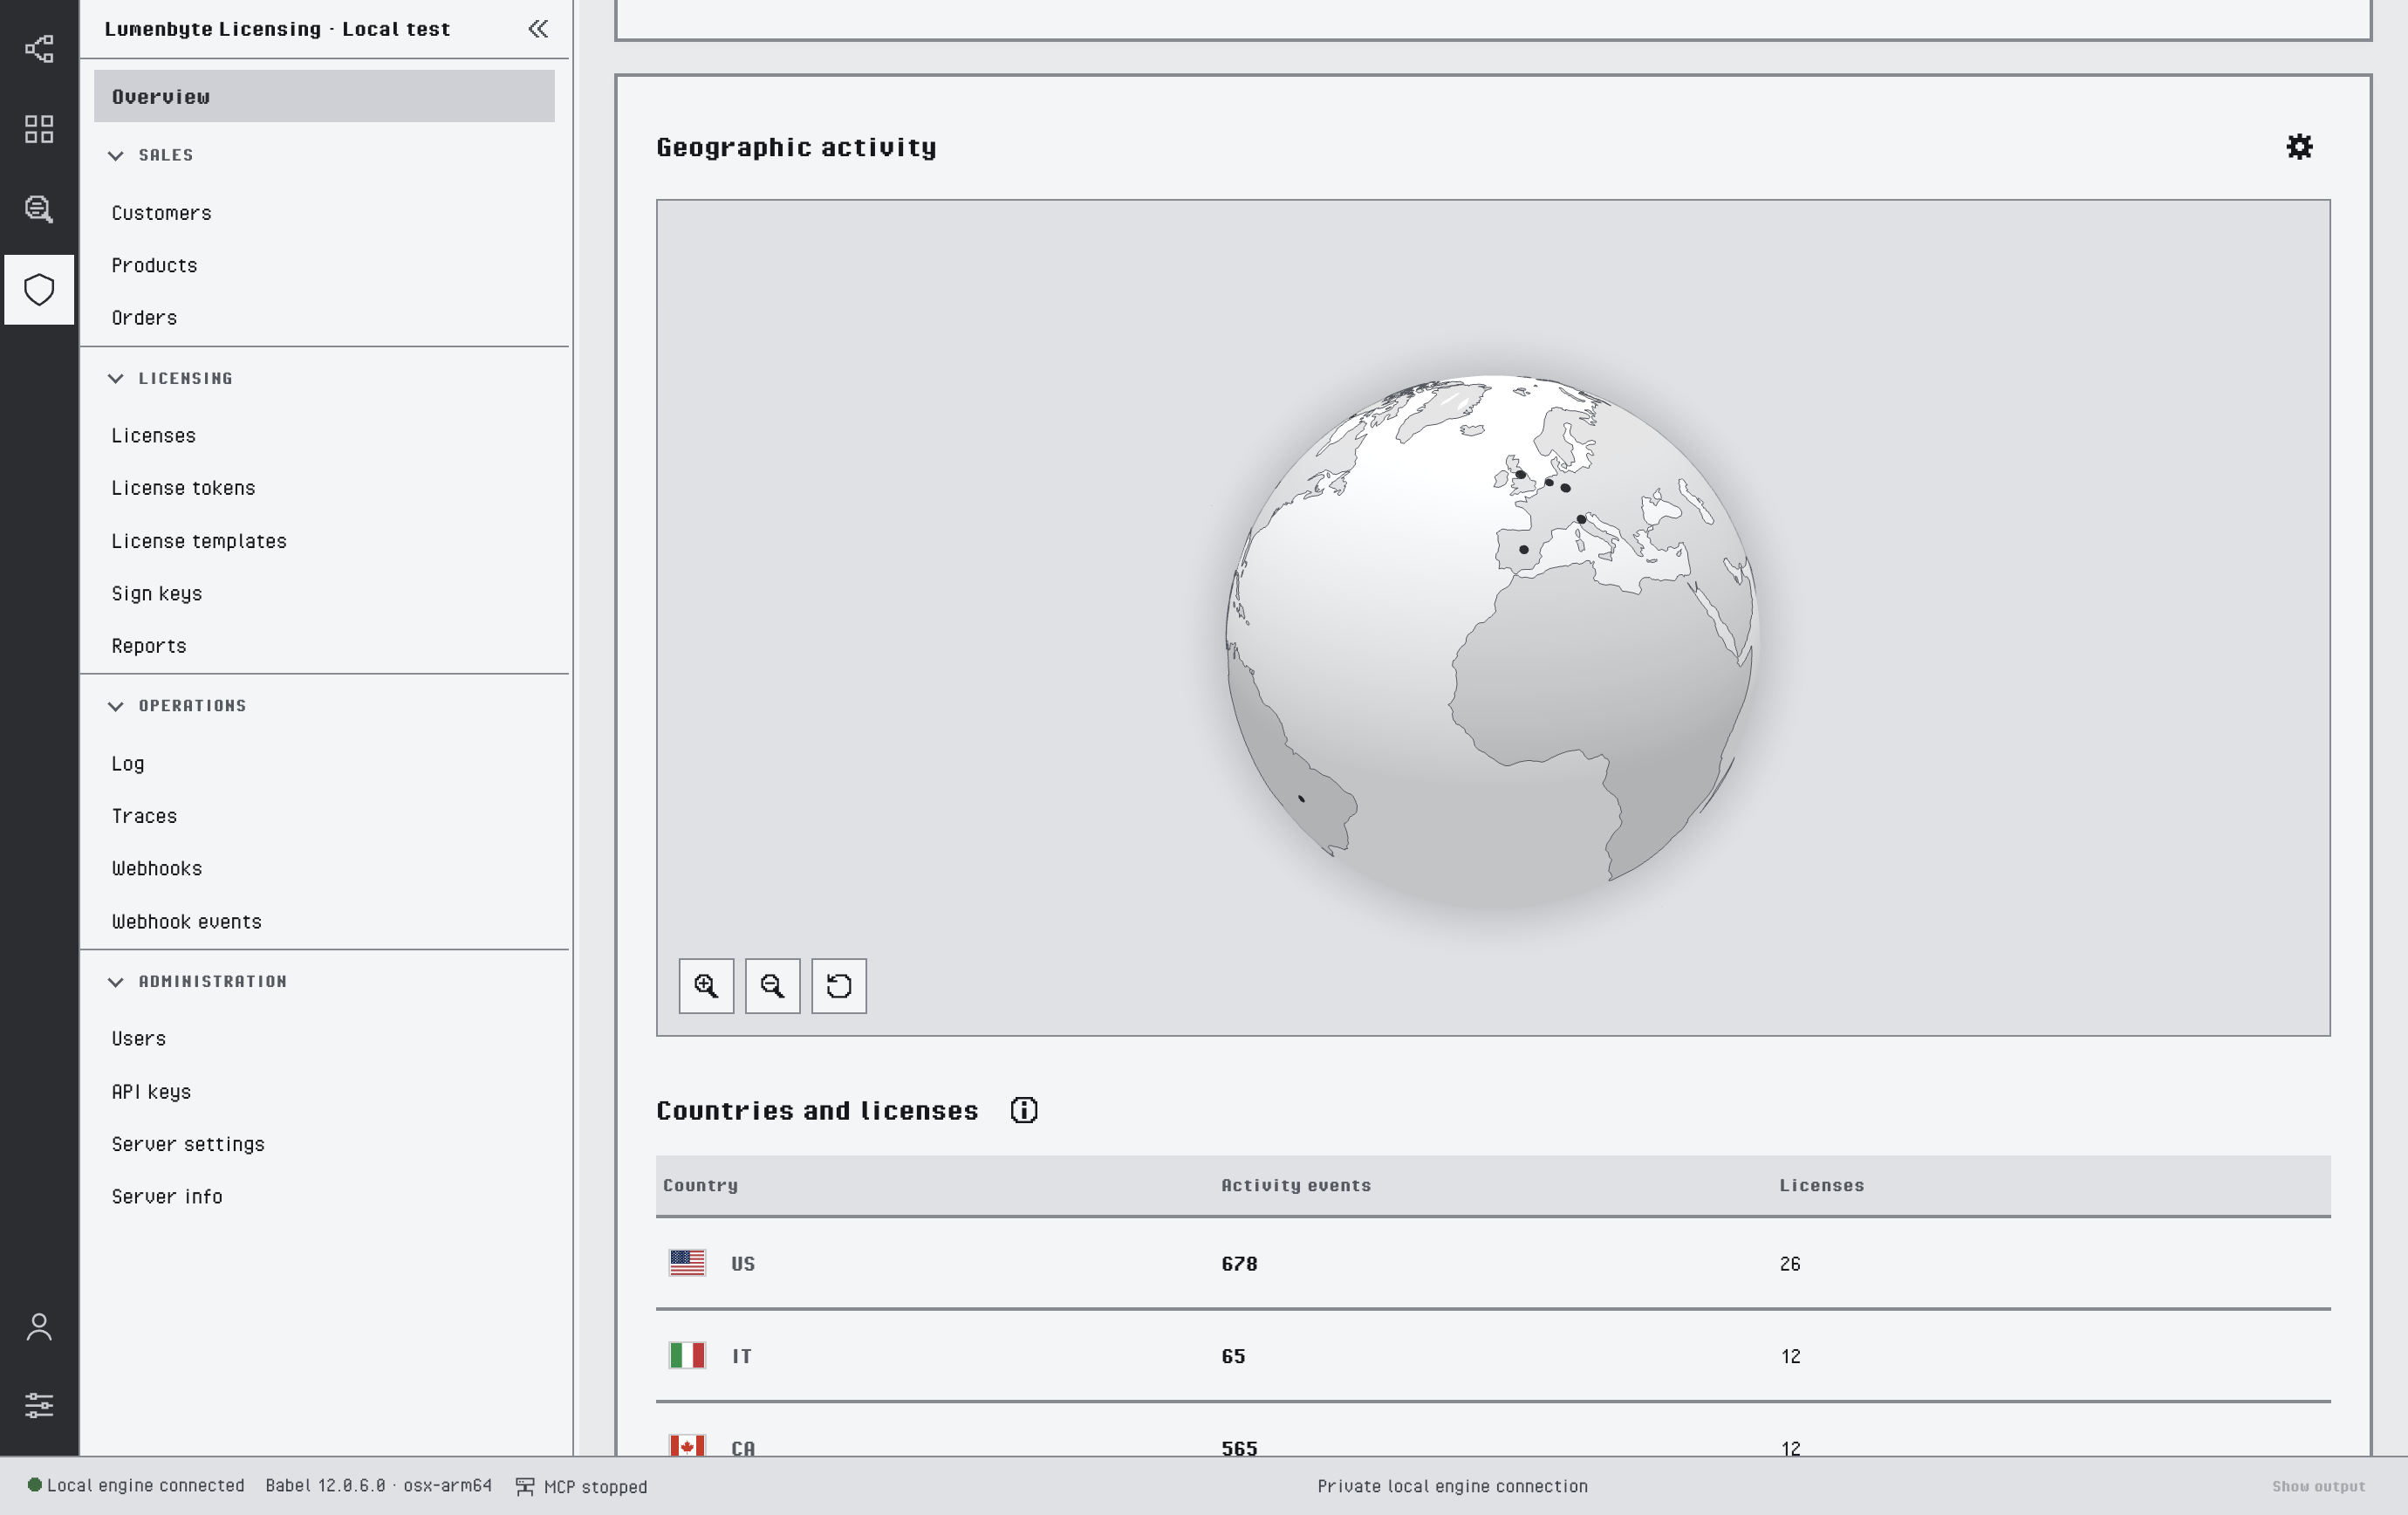
The activity globe and the countries table
For customer privacy, a country or region appears only when at least three different licenses are in it. The Info button next to the table explains the data source and the thresholds.
The globe draws the continents as outlines on a plain sphere, in the colors of the current theme. To see NASA satellite imagery instead, set Settings > Appearance > Globe style to Satellite map; Outlined continents is the default.
IP Geolocation
Babel Desktop can also look up where activity events and the licensing server are located, using an IP geolocation provider (ipapi.is). The lookup is off by default. It is configured per profile in Settings > IP geolocation by an Administrator of a local management profile. Choose the profile in Licensing profile, then set:
- Locate activity events using IP geolocation resolves the events that have no location yet. Private and reserved addresses are never sent to the provider.
- Provider and Provider endpoint select the lookup service.
- API key is the provider key, stored in the secure storage of the operating system. Remove saved API key deletes it.
- Cache lifetime (hours) controls how long resolved locations are kept in memory.
- Resolve server position using IP geolocation places a marker for the licensing server on the globe; alternatively enter Server latitude and Server longitude yourself, which needs no provider. The Configure server position button of the globe opens these settings.
Use Test connection to check the provider configuration. The Resolve locations action of the Reports and Traces views instead asks the service to resolve missing locations with the geolocation provider configured in the service; see Configuration.