Reports
The Reports page in Babel Licensing Web Application provides a comprehensive interface for monitoring and managing all types of reports submitted by licensed applications. This central hub enables you to track application health, license usage patterns, security events, and custom metrics.

Reports Dashboard
Overview
The Babel Licensing reporting system supports three distinct report types, each designed for specific monitoring and analysis needs:
- Exception Reports: Track application errors, crashes, and exceptions with detailed diagnostic information
- License Reports: Monitor how licensed features, fields, and restrictions are being used in your applications
- Custom Reports: Collect application-specific data such as security events, performance metrics, or business events
The Reports page displays all submitted reports in a unified interface, allowing you to filter, search, and analyze data across all report types.
Report Types
Understanding Report Names
The Name column in the reports grid identifies the type of report:
- ExceptionReport: Application crash and error reports
- LicenseReport: License usage tracking reports
- HackDetection, SecurityEvent, PerformanceMetrics, etc.: Custom report types defined by your application
Interface Components
The central element of the Reports page is a data grid displaying all submitted reports with the following columns:
- Name: Identifies the type of report (e.g., “ExceptionReport”, “LicenseReport”, “SecurityEvent”)
- Date: Shows the timestamp when the report was generated (format: YYYY-MM-DD HH:MM:SS)
- Address: Displays the IP address of the client machine that generated the report
- User Key: Contains the license key associated with the application instance
- Machine Id: Shows a unique identifier for the client machine
- Client Name: Indicates the client device type or name (e.g., “Mac”, “Windows PC”)
Search and Filtering
At the top of the page, you’ll find:
- A global search bar for quickly finding specific reports
- Column-specific filter icons (magnifying glass) for filtering by individual fields
- A date picker for filtering reports by specific time periods
Actions
Each report row includes action buttons:
- Edit (pencil icon): Opens the report details view for examining the full exception information
- Delete (trash icon): Removes the report from the system
Using the Reports Page
By default, the page displays all reports in reverse chronological order (newest first). You can filter by report type using the Name column filter to focus on specific report categories.
Filtering by Report Type
To view only specific types of reports:
- Click the filter icon in the Name column header
- Enter the report type name (e.g., “ExceptionReport”, “LicenseReport”)
- Press Enter to apply the filter
This allows you to focus on exception reports for debugging, license reports for usage analysis, or custom reports for application-specific monitoring.
Analyzing Report Details
To view detailed information about any report:
- Locate the report of interest in the list
- Click the edit (pencil) icon on the left side of the report row
The details view will display different information depending on the report type.
Exception Reports
Exception Reports capture comprehensive information about application crashes and errors, providing the diagnostic context needed to reproduce and fix bugs efficiently.
What Gets Reported
Exception reports include three main categories of information:
1. Exception Details
- Exception type, message, and source
- Complete stack trace with line numbers
- Inner exceptions (nested errors)
2. Environment Information
- Application name and version
- Loaded assemblies with file versions
- Environment variables (filtered for privacy)
- Running processes (optional)
- Virtual machine detection
- System clock rollback detection
3. System Information
- Operating system details (name, version, architecture)
- Processor information (cores, speed, manufacturer)
- Memory (total and available)
- Disk drives (capacity, free space)
- Display adapters
- Network adapters
Exception Report Details View
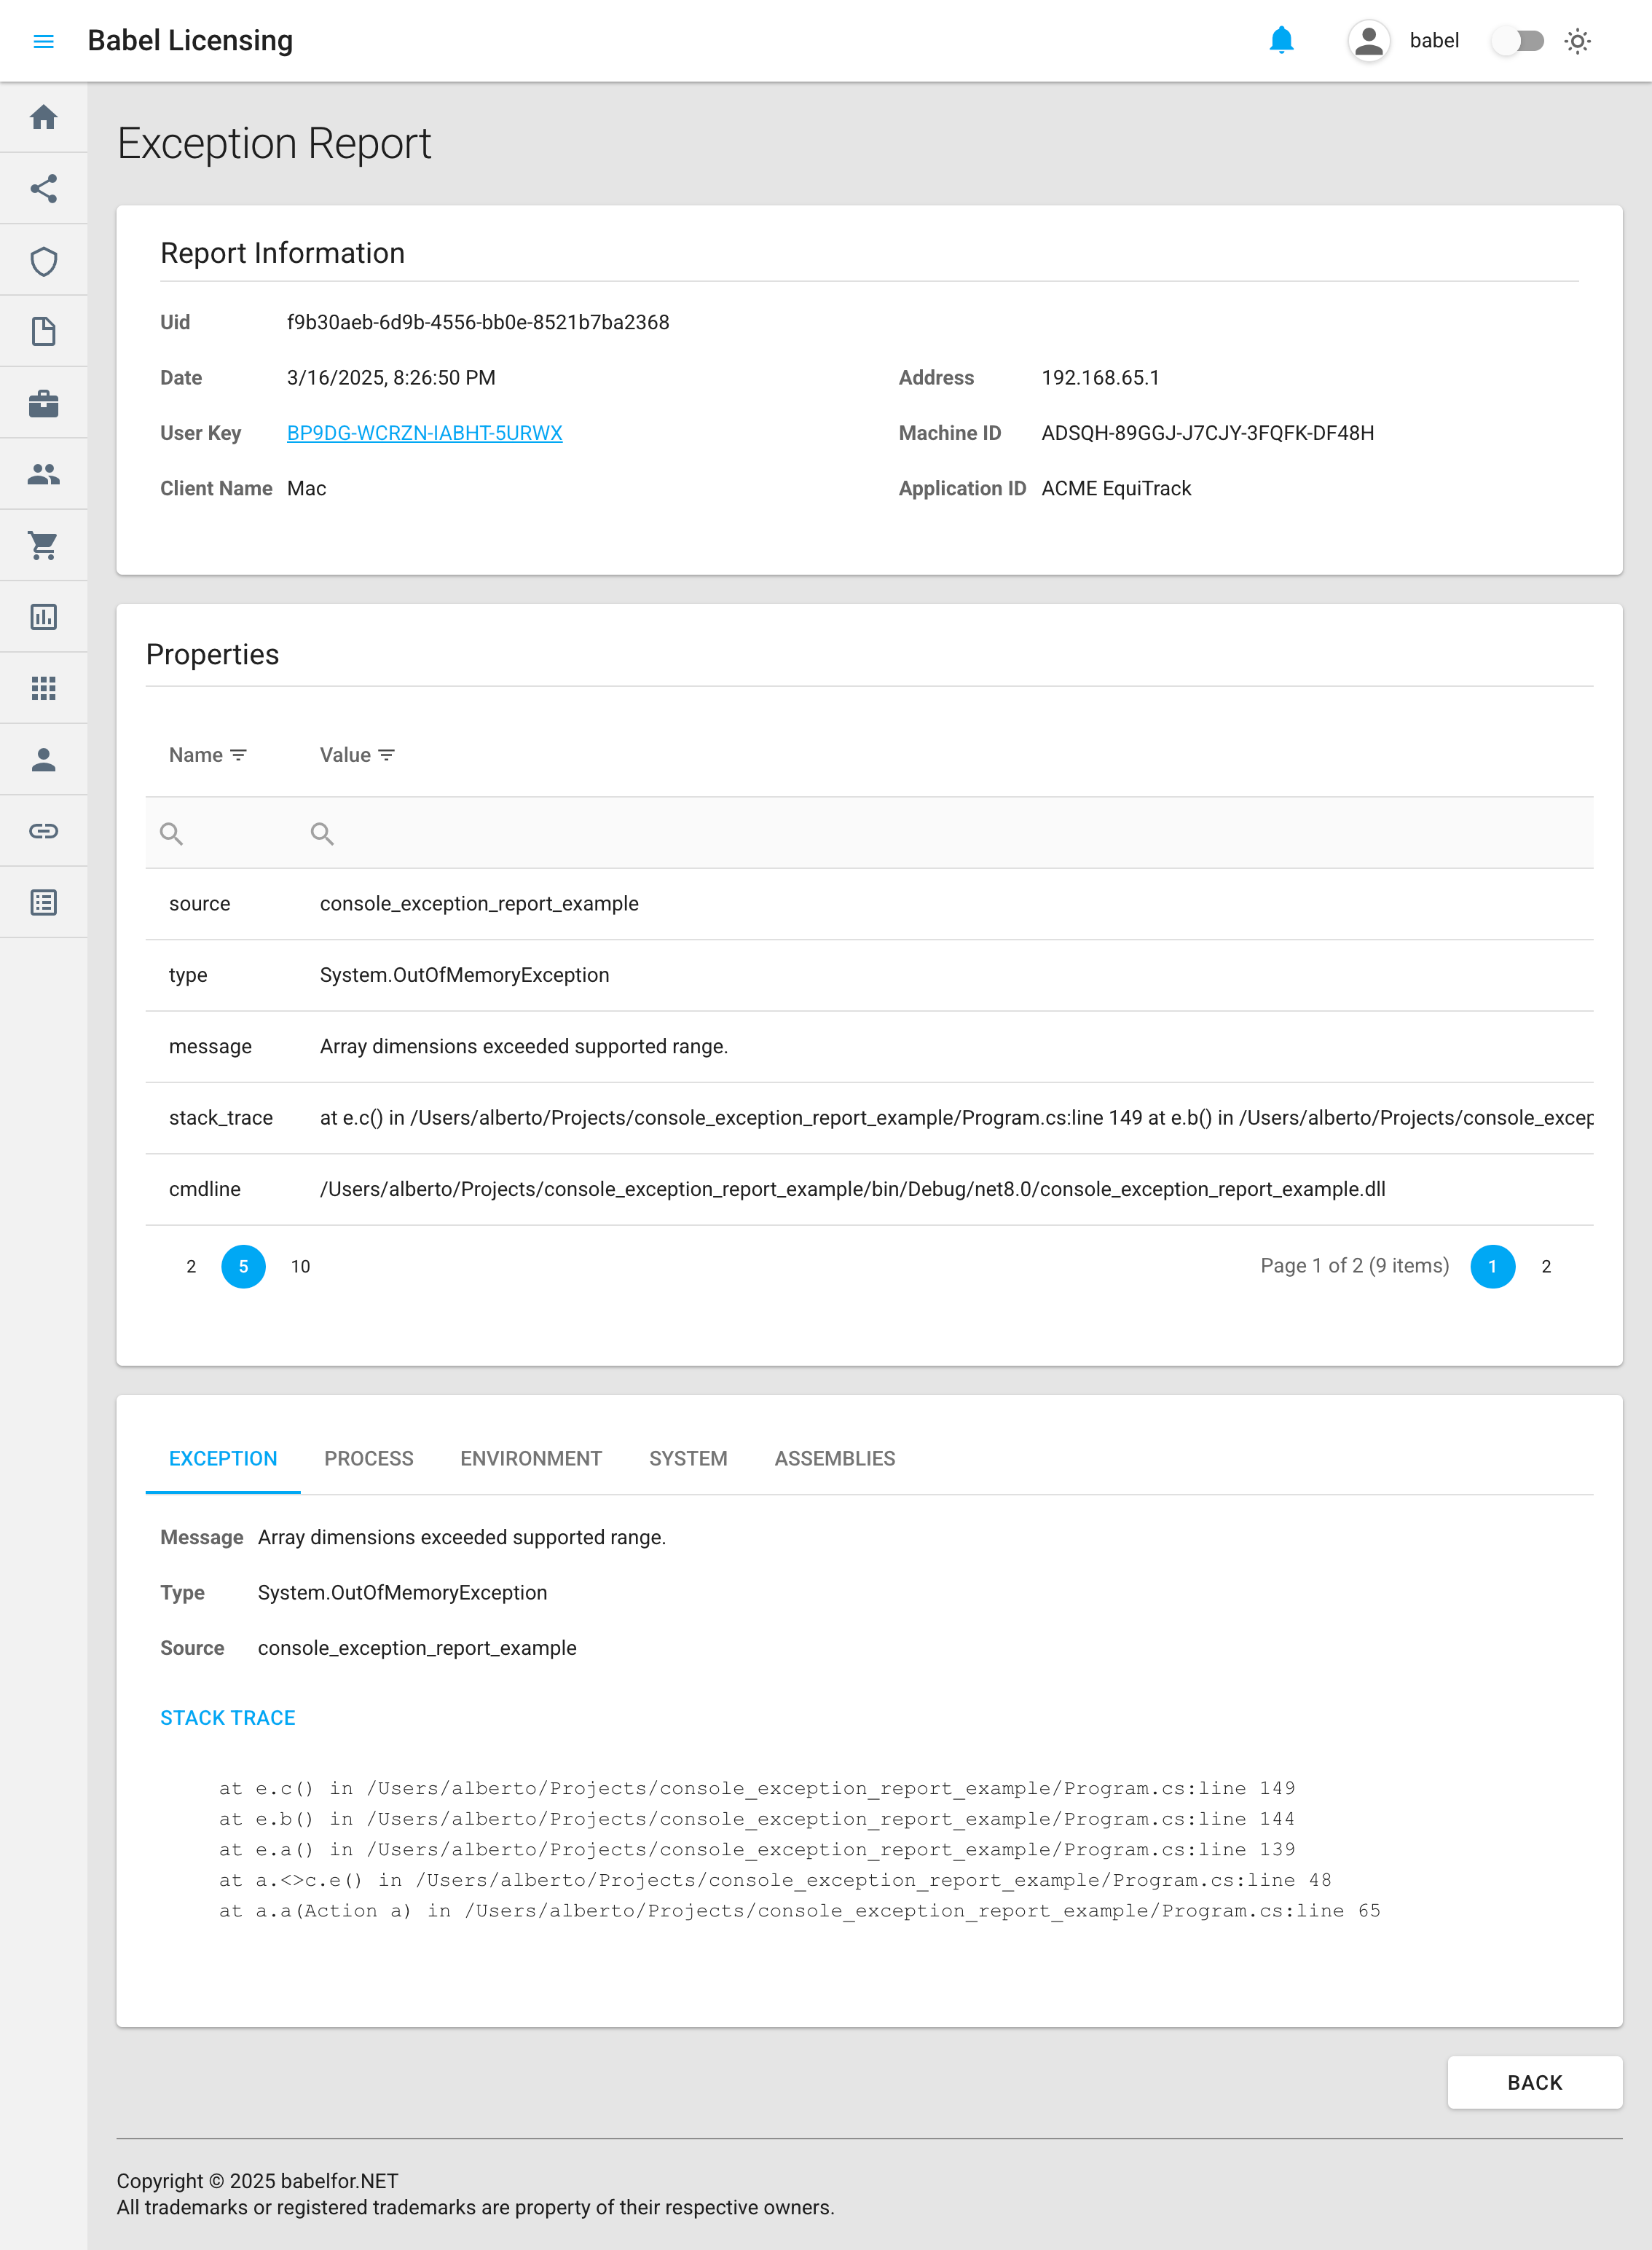
The Exception Report Details view provides an in-depth analysis of individual exception reports. When you select an exception report from the main Reports page, you’ll be presented with this comprehensive view.

Exception Report Details
Report Information Section
At the top of the page, the “Report Information” panel displays essential identifying details about the exception:
- Uid: A unique identifier for the report (e.g., “f9b30aeb-6d9b-4556-bb0e-8521b7ba2368”)
- Date: The timestamp when the exception occurred (e.g., “3/16/2025, 8:26:50 PM”)
- User Key: The license key associated with the application instance, displayed as a clickable link
- Client Name: The type of client machine (e.g., “Mac”)
- Address: IP address of the client machine that generated the report (e.g., “192.168.65.1”)
- Machine ID: A unique hardware identifier for the client device (e.g., “ADSQH-89GGJ-J7CJY-3FQFK-DF48H”)
- Application ID: The identifier of the application that generated the report (e.g., “ACME EquiTrack”)
Properties Grid
The “Properties” section provides a tabular view of additional metadata related to the exception:
- source: Identifies the source of the exception (e.g., “console_exception_report_example”)
- type: The exact exception type that occurred (e.g., “System.OutOfMemoryException”)
- message: The error message associated with the exception (e.g., “Array dimensions exceeded supported range.”)
- stack_trace: A truncated preview of the stack trace showing where the exception occurred
- cmdline: The command line used to launch the application that generated the exception
The Properties grid includes pagination controls at the bottom, allowing you to navigate through multiple pages of properties if present.
Detailed Exception Information
The bottom section of the page contains detailed information about the exception, organized into multiple tabs:
EXCEPTION (Active Tab)
This tab displays:
- Message: The complete error message (e.g., “Array dimensions exceeded supported range.”)
- Type: The exception class name (e.g., “System.OutOfMemoryException”)
- Source: The source of the exception (e.g., “console_exception_report_example”)
- STACK TRACE: The full stack trace showing the exact execution path that led to the exception, including:
- Method names
- File paths
- Line numbers
- Class names
Additional Tabs
The interface also provides several other tabs for contextual information:
- PROCESS: Information about the process in which the exception occurred
- ENVIRONMENT: Details about the system environment at the time of the exception
- SYSTEM: System configuration information
- ASSEMBLIES: List of loaded assemblies/libraries at the time of the exception
Navigation and Actions
At the bottom of the page, you’ll find:
- BACK: A button to return to the main Reports list view
Using the Report Details View
This detailed view enables developers and support teams to:
- Diagnose Issues: Pinpoint the exact cause and location of exceptions
- Reproduce Problems: Understand the context in which errors occur
- Track Patterns: Identify recurring issues across applications
- Prioritize Fixes: Determine the severity and impact of reported exceptions
- Validate Fixes: Verify that implemented solutions have resolved the reported issues
By examining the stack trace and environmental context, developers can quickly identify the root cause of the exception and implement appropriate fixes, ultimately improving the stability and reliability of their applications.
Exception Report Benefits
Exception reports offer several advantages for software providers:
- Quickly identify recurring issues in your applications
- Understand the context of exceptions to aid troubleshooting
- Monitor the stability of different application versions
- Track exception patterns across various client configurations
- Streamline the bug fixing process with detailed error information
Client-Side Implementation
To send exception reports from your application, see Exception Reports in the Reporting documentation.
License Reports
License Reports provide detailed insights into how your application uses licensed features, fields, and restrictions. These reports help you understand feature adoption, validate compliance, and make data-driven decisions about licensing strategy.

License Report Details View
What Gets Tracked
License reports automatically capture usage information when license tracking is enabled in the client application. The tracking system monitors all interactions with license components, including feature access, field reads, and restriction validations:
Feature Usage
- Feature name and ID
- Access counts per member (e.g.,
get_Data,get_IsEnabled) - First and last access timestamps
- Total access duration
Field Access
- Field name and value (truncated for privacy)
- Access patterns per member
- Read frequency
Restriction Validation
- Restriction name and type
- Validation results (Pass/Fail)
- Access times and counts
License Report Details View
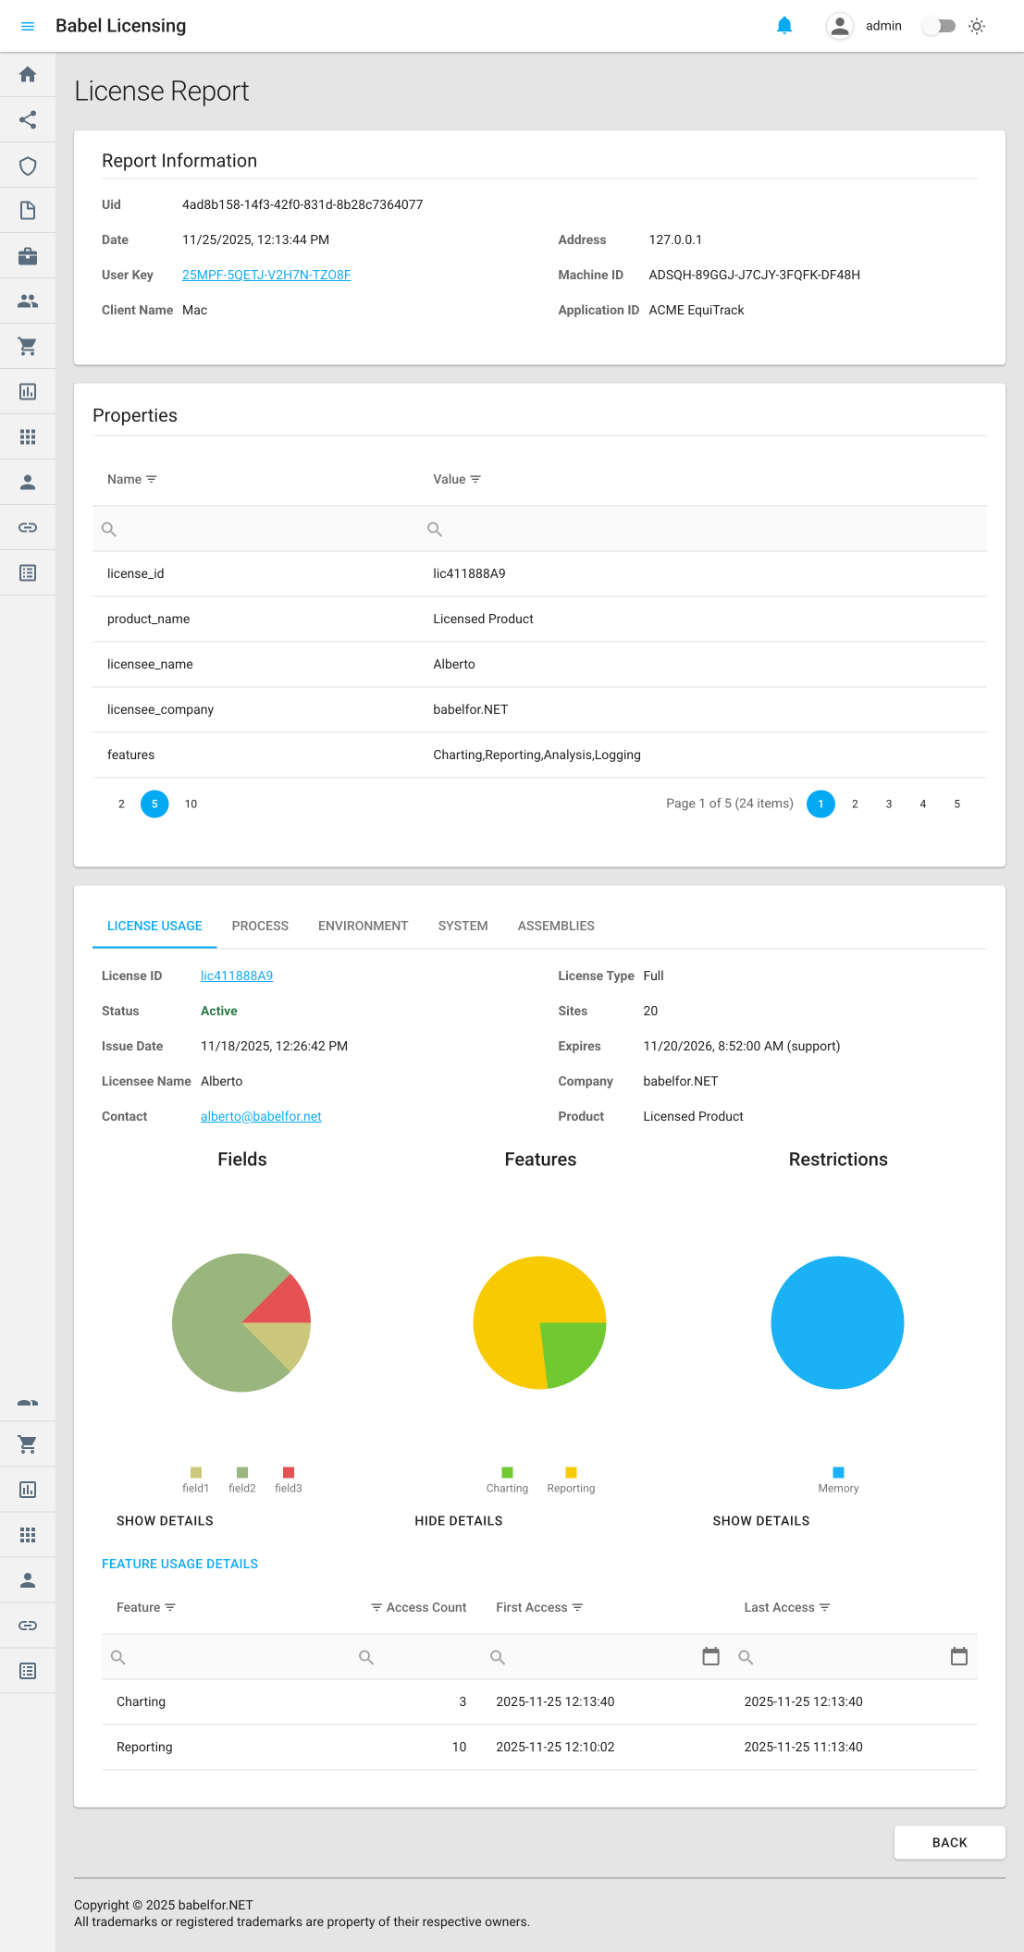
When you view a License Report in the web application, you’ll see a comprehensive dashboard that displays all tracked license usage data. The view organizes feature access, field reads, and restriction validations into easy-to-analyze sections with detailed statistics.
Report Information Section
- Uid: Unique report identifier
- Date: When the report was generated
- User Key: License key associated with the report
- Client Name: Client device type
- Address: IP address of the client machine
- Machine ID: Unique hardware identifier
- Application ID: Application that generated the report
Properties Grid
The Properties section includes license-specific metadata:
- license_id: The ID of the tracked license
- product_name: Product associated with the license
- licensee_name: Name of the licensee
- licensee_company: Company name
- features: Comma-separated list of tracked features
- fields: Comma-separated list of tracked fields
- restrictions: Comma-separated list of tracked restrictions
Detailed Tracking Information
The bottom section contains multiple tabs with tracking data:
FEATURES Tab
Displays detailed feature usage statistics:
- Feature name and ID
- Member access counts (e.g.,
get_Data: 15 accesses) - First access timestamp
- Last access timestamp
- Total access duration
FIELDS Tab
Shows field access patterns:
- Field name
- Field value (truncated)
- Member access counts
- Access timestamps
RESTRICTIONS Tab
Lists restriction validation history:
- Restriction name and type
- Validation results
- Check frequency
- Access timestamps
ENVIRONMENT Tab
Contains environment information:
- Application name and version
- Loaded assemblies
- Environment variables (filtered)
- Process information
SYSTEM Tab
Shows system configuration:
- Operating system details
- Hardware information
- Memory and disk statistics
Report Merging
License reports are automatically merged on the server when multiple reports arrive for the same license, machine, and client. This provides:
- Cumulative Statistics: Access counts are added together
- Timeline Preservation: Earliest first access and latest last access
- Historical Analysis: Complete usage patterns over time
This means each unique combination of license + machine + client has a single comprehensive report that grows over time.
License Report Benefits
License reports help you:
- Monitor Feature Adoption: See which features are used most frequently
- Identify Unused Features: Find features that are never accessed
- Track Usage Patterns: Analyze when and how often features are used
- Validate Compliance: Ensure restrictions are being checked properly
- Plan Licensing Strategy: Make data-driven decisions about feature packaging
Client-Side Implementation
To enable license tracking and send license reports from your application, see License Reports in the Reporting documentation.
Custom Reports
Custom Reports allow you to collect any application-specific data that doesn’t fit into the standard exception or license report categories. By creating custom report classes that inherit from the Report base class, you can send structured data tailored to your application’s needs. Common examples include security events, performance metrics, business events, and diagnostic information.

Custom Report Details View
Common Custom Report Types
Security Event Reports
Track potential security threats and attack patterns:
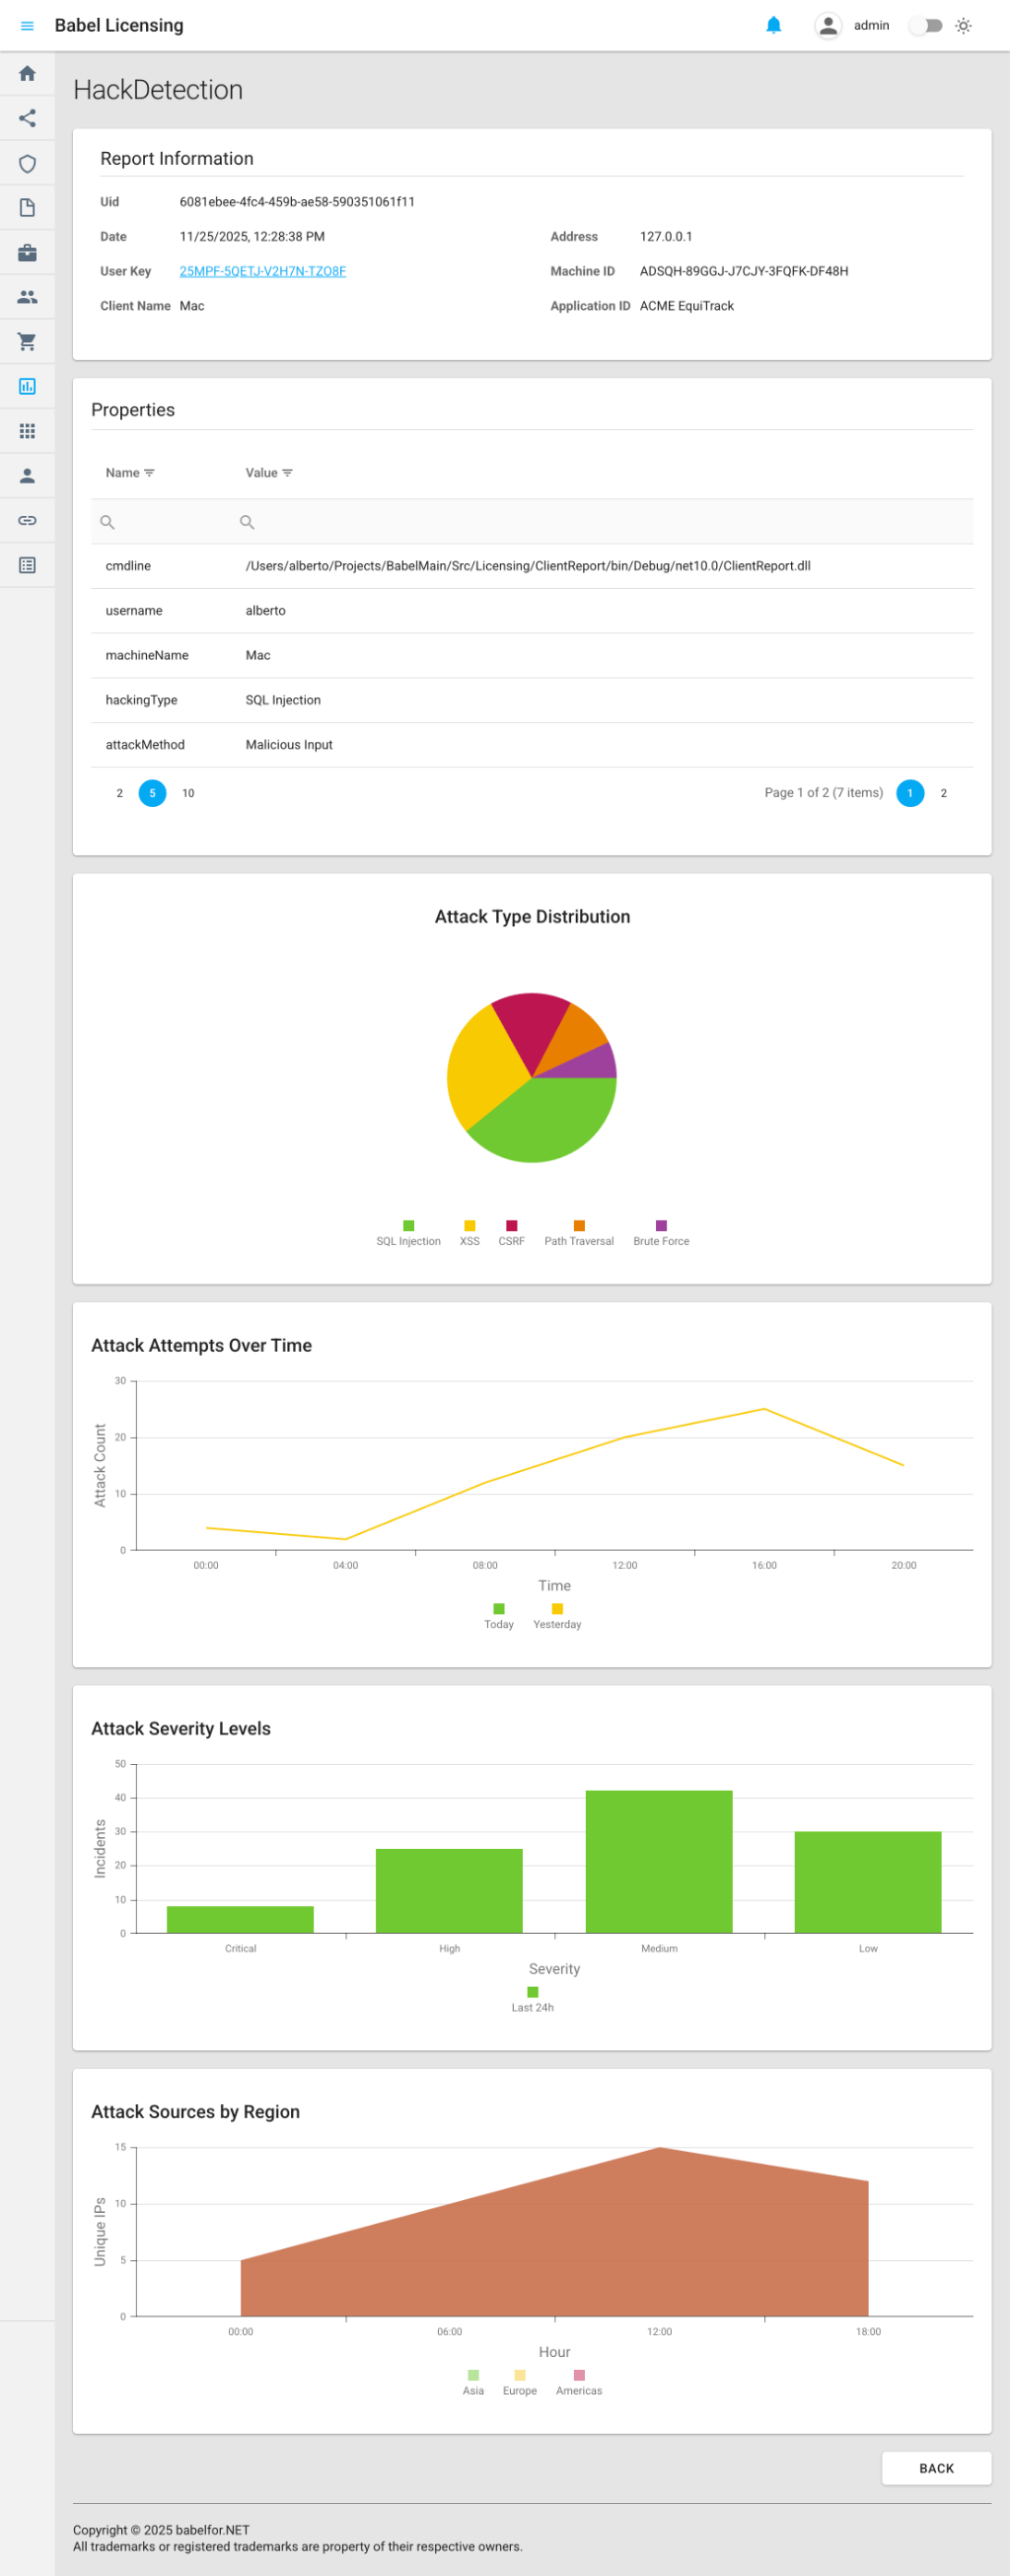
- HackDetection: Unauthorized access attempts, SQL injection, XSS, CSRF, and other attack types with detailed statistics including attack distribution, severity levels, and geographic sources
- SecurityEvent: Suspicious activities, intrusion detection, and anomaly tracking
- AuthenticationFailure: Failed login attempts, brute force detection, and suspicious credential usage
Performance Metrics Reports
Monitor application performance:
- PerformanceMetrics: Response times, throughput, resource usage
- ApiMetrics: API endpoint performance statistics
Business Event Reports
Track important business events:
- BusinessEvent: Purchases, registrations, milestones
- AuditLog: User actions for compliance
Diagnostic Reports
Custom diagnostic information:
- Diagnostic: Component health checks, configuration issues
Custom Report Details View
When you view a custom report in the web application, the details view displays:
Report Information Section
Standard metadata for all reports:
- Unique identifier (Uid)
- Timestamp
- User key
- Client information
- Machine ID
Properties Grid
Custom reports have flexible properties based on the report type. Common properties include:
For Security Event Reports (e.g., HackDetection):
- hackingType: Type of attack detected (e.g., SQL Injection, XSS, CSRF)
- attackMethod: Method used in the attack (e.g., Malicious Input, Parameter Tampering)
- hackDetails: Detailed description of the detected threat
- machineName: Machine where the attack was detected
- attackDistribution: Breakdown of attack types with counts (SQL Injection, XSS, CSRF, Path Traversal, Brute Force)
- attackTimeline: Time-series data showing attack patterns over days
- severityLevels: Distribution of attacks by severity (Critical, High, Medium, Low)
- attackSources: Geographic distribution of attack origins
For Performance Metrics Reports:
- average_response_time_ms: Average response time
- peak_response_time_ms: Peak response time
- total_requests: Total number of requests
- failed_requests: Number of failed requests
- error_rate: Percentage of failed requests
- cpu_usage_percent: CPU utilization
- memory_usage_mb: Memory consumption
For Business Event Reports:
- event_category: Category of business event
- event_action: Action performed
- user_id: User who triggered the event
- entity_type: Type of entity (Order, User, etc.)
- entity_id: Entity identifier
- transaction_amount: Financial transaction amount
Detailed Information Tabs
Custom reports may include additional tabs with contextual information:
- ENVIRONMENT: Application and runtime environment details
- SYSTEM: Hardware and OS information
- CUSTOM DATA: Report-specific data in JSON format
Data Visualization
Custom reports that include structured data (such as attack distributions, timelines, and severity breakdowns) are automatically rendered with interactive visualizations:
- Pie Charts: Display distribution data such as attack types or severity levels
- Line Charts: Show time-series data like attack timelines across multiple days
- Bar Charts: Compare categorical data such as geographic attack sources
- Area Charts: Visualize cumulative trends over time
These visualizations provide immediate insights into your custom report data without requiring external analytics tools.
Custom Report Benefits
Custom reports provide:
- Flexibility: Track any data relevant to your application
- Security Monitoring: Detect and respond to threats in real-time
- Performance Insights: Monitor application health and performance
- Business Intelligence: Track important business metrics
- Audit Compliance: Maintain audit trails for regulatory requirements
Client-Side Implementation
To create and send custom reports from your application, see Custom Reports in the Reporting documentation.
Report Management
Searching and Filtering
Use the search and filtering capabilities to find specific reports:
- Global Search: Use the search bar to find reports across all columns
- Column Filters: Click the filter icon in any column header to filter by that field
- Date Filtering: Use the date picker to filter reports by time period
- Report Type Filter: Filter by the Name column to show only specific report types
Deleting Reports
To remove a report from the system:
- Locate the report in the list
- Click the delete (trash) icon on the right side of the report row
- Confirm the deletion
Note: Deleted reports cannot be recovered. Exercise caution when deleting reports.
Exporting Report Data
While the web interface provides comprehensive viewing capabilities, you can also access report data programmatically through the Babel Licensing Service API for:
- Bulk data export
- Integration with external analytics tools
- Custom reporting and visualization
- Automated alerting and monitoring
Overall Benefits
The Reports page offers comprehensive advantages for software providers:
- Unified Dashboard: View all report types in a single interface
- Quick Issue Identification: Rapidly identify and prioritize problems
- Usage Analytics: Understand how customers use your software
- Security Monitoring: Detect threats and unauthorized access
- Data-Driven Decisions: Make informed choices about product development
- Improved Support: Quickly diagnose and resolve customer issues
- Compliance: Maintain audit trails and usage records
With the Reports page, you can improve application quality, enhance user experience, optimize licensing strategies, and reduce the time required to identify and resolve issues.
Related Documentation
For information on implementing reporting in your client applications:
- Reporting Overview - Introduction to the reporting framework
- Exception Reports - Implementing crash and error reporting
- License Reports - Enabling license usage tracking
- Custom Reports - Creating custom report types