カスタムレポート
組み込みの例外レポートとライセンス使用状況レポートに加えて、Babel Licensing では、アプリケーション固有のニーズに合わせたカスタムレポートを作成できます。カスタムレポートを使うと、任意の構造化データを Babel Licensing Service に送信し、一元的に収集、分析、監視できます。
概要
カスタムレポートは、次の用途に役立ちます。
- セキュリティイベント:ハッキングの試み、不正アクセス、不審な動作の可能性を検出して報告します
- アプリケーションの指標:アプリケーション独自のパフォーマンスや使用状況の指標を追跡します
- ビジネスイベント:重要なビジネスイベントやマイルストーンを報告します
- 診断:トラブルシューティングのために、独自の診断データを送信します
- 監査証跡:コンプライアンス要件に対応する監査ログを作成します
コンソールアプリケーションのサンプル
実用的なサンプルから始めるには、console-custom-report-example リポジトリをクローンします。このサンプルは、Babel のレポート機能を使ってカスタムレポートを作成し、送信する方法を示します。
Git クライアントを開く
お好みの Git クライアントまたはコマンドラインを開きます。
リポジトリをクローンする
次のコマンドを実行して、GitHub リポジトリをクローンします。
git clone https://github.com/babelfornet/console-custom-report-example.gitプロジェクトディレクトリに移動する
リポジトリをクローンしたら、プロジェクトディレクトリに移動します。
cd console-custom-report-exampleサンプルを確認して実行する
これで、サンプルコードを確認して実行する準備が整いました。
console-custom-report-example は、Babel Licensing のクライアントライブラリをアプリケーションに組み込み、カスタムレポートを作成して Babel Licensing Service に送信する方法を示します。コードの内容は次のとおりです。
- BabelReporting の初期化:サンプルコードは
BabelReportingオブジェクトを初期化し、サービスの URL とクライアント ID を設定します。
private BabelReporting CreateReportingClient()
{
    var reporting = new BabelReporting();

    reporting.Configuration.ClientId = ClientId;
    reporting.Configuration.ServiceUrl = ServiceUrl;
    reporting.Configuration.UseHttp(http => {
        http.Timeout = TimeSpan.FromSeconds(3);
        http.Handler = new HttpClientHandler() {
            ServerCertificateCustomValidationCallback = (message, cert, chain, errors) => true
        };
    });

    reporting.BeforeSendReport += (s, e) => {
        e.Report.Properties.Add("cmdline", Environment.CommandLine);
        e.Report.Properties.Add("username", Environment.UserName);
    };

    return reporting;
}-
ユーザーキー:サンプルコードは、クライアントがレポートを送信することを認可するためのユーザーキー(
UserKey)を使用します。必ず有効なユーザーキーに置き換えてください。ユーザーキーを生成するには、フローティングライセンスまたはライセンスアクティベーションの説明を参照してください。 -
カスタムレポートクラス:
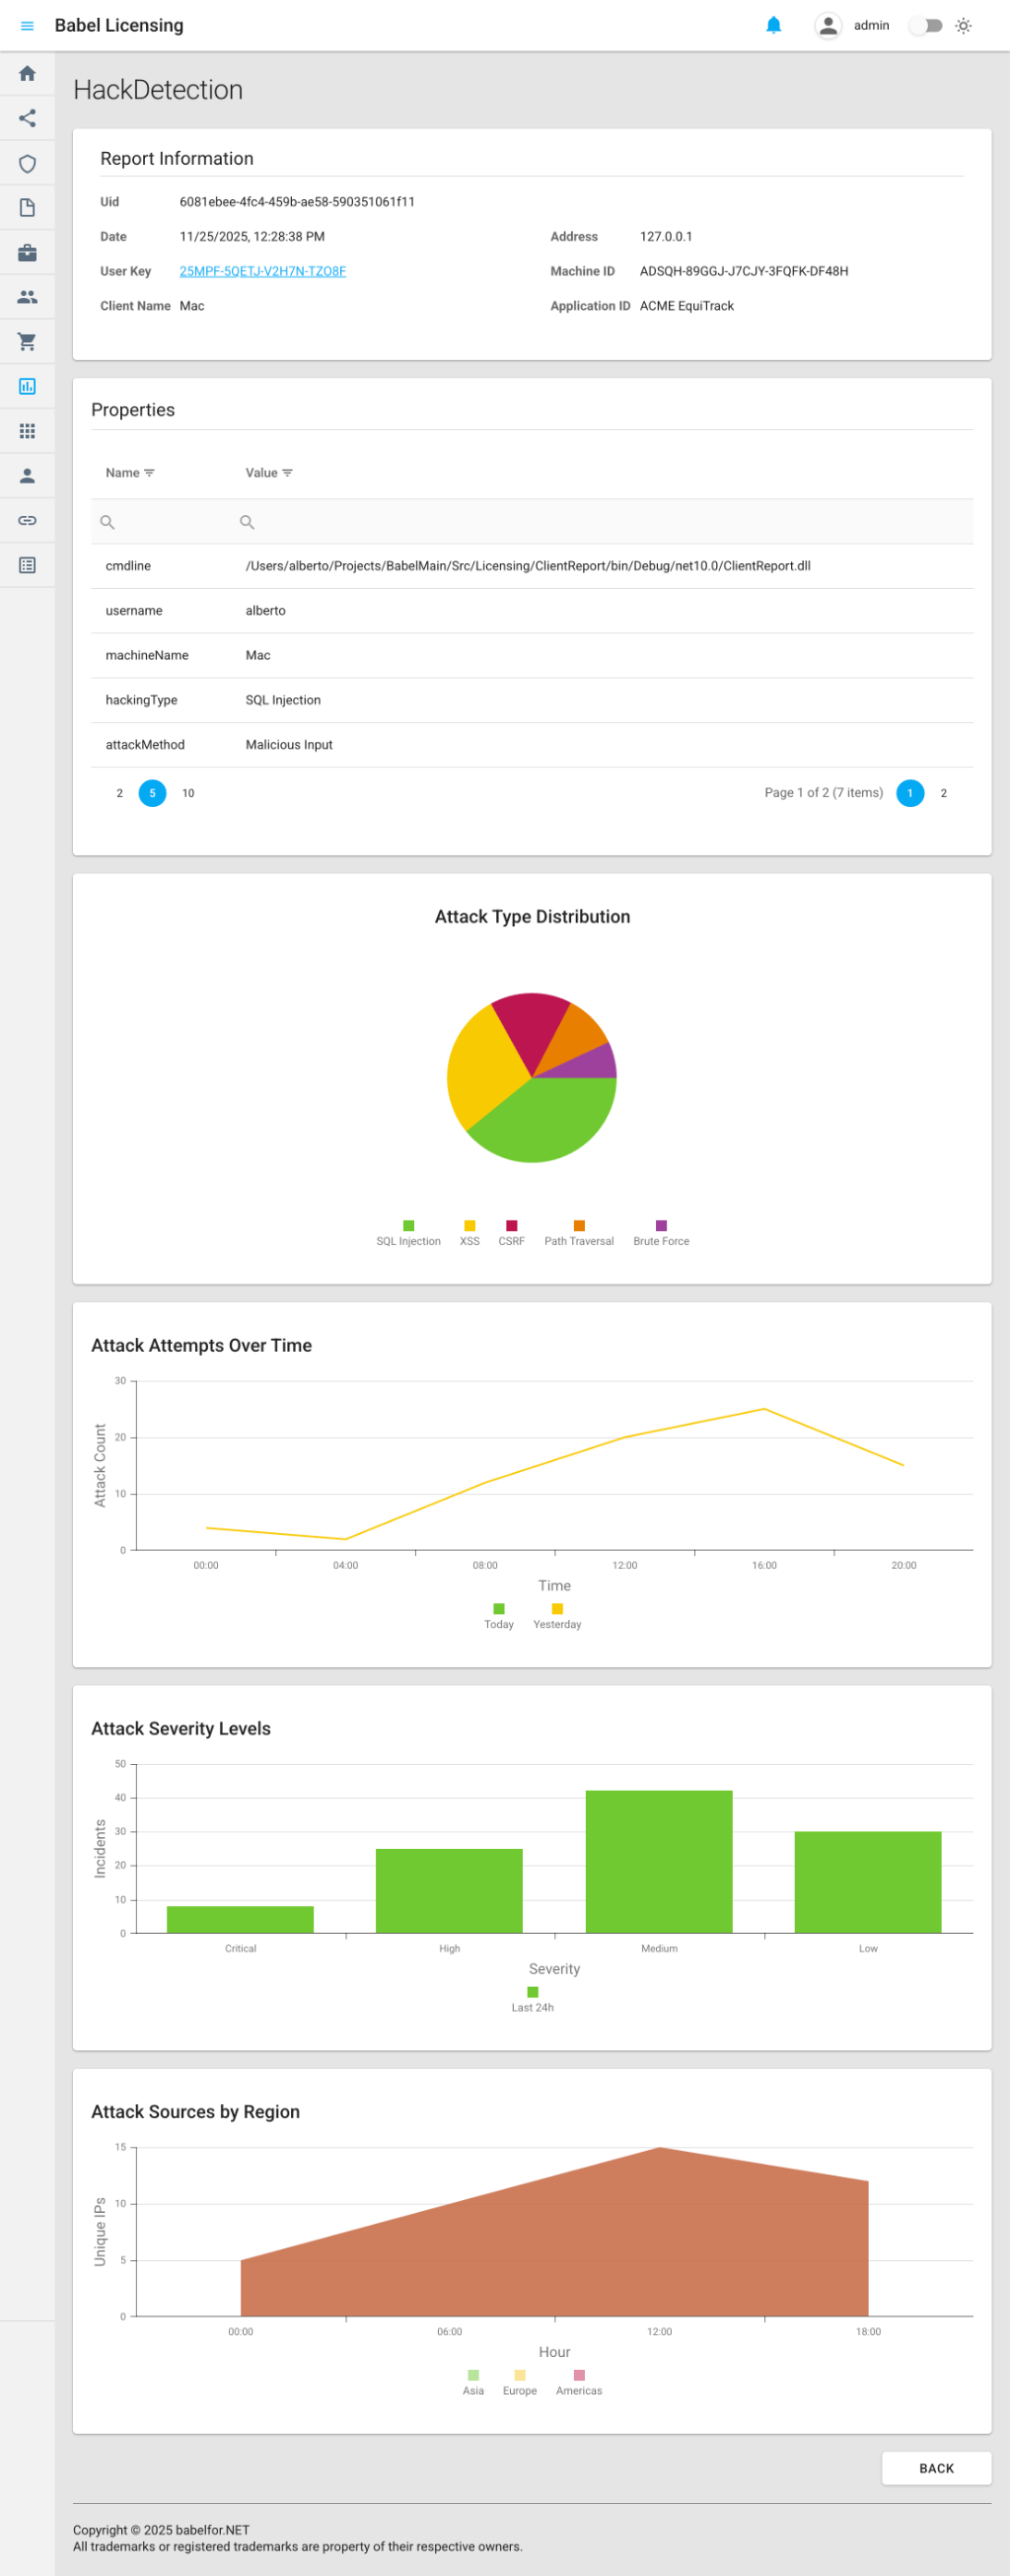
HackDetectionReportクラスはReportを継承し、セキュリティイベントを追跡するためのカスタムプロパティを定義します。また、ReportPlotを使用して、Web アプリケーションで描画されるインタラクティブなチャートを作成します。
class HackDetectionReport : Report
{
    public string HackingType { get; set; } = "unknown";
    public string AttackMethod { get; set; } = "unknown";
    public string HackDetails { get; set; } = "no_details";

    public HackDetectionReport() : base("HackDetection") { }

    public override void Build()
    {
        // Add custom hack detection information
        Properties.Add("machineName", Environment.MachineName);
        Properties.Add("hackingType", HackingType);
        Properties.Add("attackMethod", AttackMethod);
        Properties.Add("hackDetails", HackDetails);

        // Add attack distribution pie chart
        var attackDistribution = new ReportPlot(ReportPlotType.Pie, "Attack Type Distribution")
            .SetHeight(400)
            .AddSeries("Attacks", new List<object>
            {
                new { type = "SQL Injection", count = 45 },
                new { type = "XSS", count = 32 },
                new { type = "CSRF", count = 18 },
                new { type = "Path Traversal", count = 12 },
                new { type = "Brute Force", count = 8 }
            });
        attackDistribution.Series[0].ArgumentField = "type";
        attackDistribution.Series[0].ValueField = "count";
        Properties.Add("attackDistribution", attackDistribution.ToDictionary());

        // Add attack timeline line chart
        var attackTimeline = new ReportPlot(ReportPlotType.Line, "Attack Attempts Over Time")
            .SetAxisTitles("Time", "Attack Count")
            .SetHeight(350)
            .AddSeries("Today", new List<object>
            {
                new { hour = "00:00", attempts = 5 },
                new { hour = "04:00", attempts = 3 },
                new { hour = "08:00", attempts = 15 },
                new { hour = "12:00", attempts = 28 },
                new { hour = "16:00", attempts = 22 },
                new { hour = "20:00", attempts = 18 }
            })
            .AddSeries("Yesterday", new List<object>
            {
                new { hour = "00:00", attempts = 4 },
                new { hour = "04:00", attempts = 2 },
                new { hour = "08:00", attempts = 12 },
                new { hour = "12:00", attempts = 20 },
                new { hour = "16:00", attempts = 25 },
                new { hour = "20:00", attempts = 15 }
            });
        attackTimeline.Series[0].ArgumentField = "hour";
        attackTimeline.Series[0].ValueField = "attempts";
        attackTimeline.Series[1].ArgumentField = "hour";
        attackTimeline.Series[1].ValueField = "attempts";
        Properties.Add("attackTimeline", attackTimeline.ToDictionary());

        // Add severity bar chart
        var severityChart = new ReportPlot(ReportPlotType.Bar, "Attack Severity Levels")
            .SetAxisTitles("Severity", "Incidents")
            .SetHeight(350)
            .AddSeries("Last 24h", new List<object>
            {
                new { severity = "Critical", incidents = 8 },
                new { severity = "High", incidents = 25 },
                new { severity = "Medium", incidents = 42 },
                new { severity = "Low", incidents = 30 }
            });
        severityChart.Series[0].ArgumentField = "severity";
        severityChart.Series[0].ValueField = "incidents";
        Properties.Add("severityChart", severityChart.ToDictionary());

        // Add IP source area chart
        var ipSourceChart = new ReportPlot(ReportPlotType.Area, "Attack Sources by Region")
            .SetAxisTitles("Hour", "Unique IPs")
            .SetHeight(350)
            .AddSeries("Asia", new List<object>
            {
                new { hour = "00:00", ips = 12 },
                new { hour = "06:00", ips = 18 },
                new { hour = "12:00", ips = 25 },
                new { hour = "18:00", ips = 22 }
            })
            .AddSeries("Europe", new List<object>
            {
                new { hour = "00:00", ips = 8 },
                new { hour = "06:00", ips = 15 },
                new { hour = "12:00", ips = 20 },
                new { hour = "18:00", ips = 18 }
            })
            .AddSeries("Americas", new List<object>
            {
                new { hour = "00:00", ips = 5 },
                new { hour = "06:00", ips = 10 },
                new { hour = "12:00", ips = 15 },
                new { hour = "18:00", ips = 12 }
            });
        ipSourceChart.Series[0].ArgumentField = "hour";
        ipSourceChart.Series[0].ValueField = "ips";
        ipSourceChart.Series[1].ArgumentField = "hour";
        ipSourceChart.Series[1].ValueField = "ips";
        ipSourceChart.Series[2].ArgumentField = "hour";
        ipSourceChart.Series[2].ValueField = "ips";
        Properties.Add("ipSourceChart", ipSourceChart.ToDictionary());

        base.Build();
    }
}-
BeforeSendReport イベント:このサンプルは
BeforeSendReportイベントを購読します。このイベントでは、送信前のレポートにプロパティを追加できます。このイベントハンドラーでは、cmdline(コマンドライン)やusername(現在のユーザーの名前)などのカスタムプロパティが追加されます。 -
レポートの送信:
SendAsyncメソッドは、カスタムレポートを Babel Licensing Service に送信します。
private async Task SendHackDetectionReportAsync()
{
    var hackReport = new HackDetectionReport
    {
        HackingType = "SQL Injection",
        AttackMethod = "Malicious Input",
        HackDetails = "Detected SQL keywords in user input"
    };
    await _reporting.SendAsync(UserKey, hackReport);
    Console.WriteLine("HackDetectionReport sent.");
}
カスタムレポートの例
console-custom-report-example は、カスタムレポートの種類を作成して Babel Licensing Service に送信する方法を実際に示します。カスタムレポートをアプリケーションに組み込むことで、セキュリティイベント、アプリケーションの指標、ビジネスイベントなど、アプリケーションに関係する任意の構造化データを追跡できます。
カスタムレポートの作成
カスタムレポートを作成するには、基底クラス Report を継承します。
using Babel.Licensing.Reports;

public class HackDetectionReport : Report
{
    // Custom properties for your report
    public string HackingType { get; set; } = "unknown";
    public string AttackMethod { get; set; } = "unknown";
    public string HackDetails { get; set; } = "no_details";

    // Constructor: specify report name
    public HackDetectionReport() : base("HackDetection")
    {
    }

    // Build method: populate report properties
    public override void Build()
    {
        // Add custom properties to the report
        Properties.Add("machine_name", Environment.MachineName);
        Properties.Add("hacking_type", HackingType);
        Properties.Add("attack_method", AttackMethod);
        Properties.Add("detection_details", HackDetails);
        Properties.Add("detected_at", DateTime.UtcNow);

        // Call base to generate final JSON structure
        base.Build();
    }
}
Report 基底クラス
Report クラスは、すべてのレポートの基盤となります。
主なプロパティ
- Name:レポートの種類の一意な識別子(「HackDetection」、「PerformanceMetrics」など)
- Content:JSON にシリアル化されたレポートデータ(
Build()が生成します) - Version:レポート形式のバージョン(現在は「1.0」)
- Date:レポートの作成日時
- Encrypted:内容が暗号化されているかどうかを示すフラグ
- Properties:カスタムのキーと値のデータを格納するディクショナリ
主なメソッド
- Build():独自のプロパティを設定するために、このメソッドをオーバーライドします
- Create(string report, string password):JSON からレポートを逆シリアル化します
- FromException(Exception ex, ExceptionReportOptions options):例外レポート用のファクトリメソッド
カスタムレポートの送信
カスタムレポートクラスを作成したら、BabelReporting を使って送信します。
using Babel.Licensing.Services;

// Initialize reporting service
var reporting = new BabelReporting();
reporting.Configuration.ServiceUrl = "https://licensing.example.com";
reporting.Configuration.ClientId = "MyApplication";

// Create and configure your custom report
var hackReport = new HackDetectionReport
{
    HackingType = "SQL Injection",
    AttackMethod = "Malicious Input",
    HackDetails = "Detected SQL keywords in user input: ' OR '1'='1"
};

// Send the report
var result = await reporting.SendAsync(userKey, hackReport);

if (result.Success)
{
    Console.WriteLine($"Report sent: {result.ReportUid}");
}
else
{
    Console.WriteLine($"Failed: {result.Error?.Message}");
}
実践的な例
例 1:セキュリティイベントレポート
潜在的なセキュリティ上の脅威を検出して報告します。
public class SecurityEventReport : Report
{
    public string EventType { get; set; }
    public string Severity { get; set; }
    public string SourceIP { get; set; }
    public string UserAgent { get; set; }
    public string RequestPath { get; set; }
    public Dictionary<string, string> AdditionalData { get; set; }

    public SecurityEventReport() : base("SecurityEvent")
    {
        AdditionalData = new Dictionary<string, string>();
    }

    public override void Build()
    {
        Properties.Add("event_type", EventType);
        Properties.Add("severity", Severity);
        Properties.Add("source_ip", SourceIP);
        Properties.Add("user_agent", UserAgent);
        Properties.Add("request_path", RequestPath);
        Properties.Add("timestamp", DateTime.UtcNow);
        Properties.Add("machine_id", GetMachineId());

        // Add all additional data
        foreach (var kvp in AdditionalData)
        {
            Properties.Add(kvp.Key, kvp.Value);
        }

        base.Build();
    }

    private string GetMachineId()
    {
        // Implementation to get unique machine identifier
        return Environment.MachineName;
    }
}

// Usage
public async Task ReportSuspiciousLogin(string ipAddress, string userAgent)
{
    var report = new SecurityEventReport
    {
        EventType = "SuspiciousLogin",
        Severity = "High",
        SourceIP = ipAddress,
        UserAgent = userAgent,
        RequestPath = "/api/auth/login"
    };

    report.AdditionalData.Add("failed_attempts", "5");
    report.AdditionalData.Add("time_window", "60s");

    await _reporting.SendAsync(_userKey, report);
}
例 2:パフォーマンス指標レポート
アプリケーションのパフォーマンス指標を追跡します。
public class PerformanceMetricsReport : Report
{
    public double AverageResponseTime { get; set; }
    public double PeakResponseTime { get; set; }
    public int TotalRequests { get; set; }
    public int FailedRequests { get; set; }
    public double CpuUsage { get; set; }
    public double MemoryUsage { get; set; }
    public TimeSpan Uptime { get; set; }

    public PerformanceMetricsReport() : base("PerformanceMetrics")
    {
    }

    public override void Build()
    {
        Properties.Add("average_response_time_ms", AverageResponseTime);
        Properties.Add("peak_response_time_ms", PeakResponseTime);
        Properties.Add("total_requests", TotalRequests);
        Properties.Add("failed_requests", FailedRequests);
        Properties.Add("error_rate", CalculateErrorRate());
        Properties.Add("cpu_usage_percent", CpuUsage);
        Properties.Add("memory_usage_mb", MemoryUsage);
        Properties.Add("uptime_hours", Uptime.TotalHours);
        Properties.Add("collection_time", DateTime.UtcNow);

        base.Build();
    }

    private double CalculateErrorRate()
    {
        if (TotalRequests == 0) return 0;
        return (double)FailedRequests / TotalRequests * 100;
    }
}

// Usage with periodic reporting
public class MetricsCollector
{
    private readonly BabelReporting _reporting;
    private readonly Timer _timer;
    private readonly PerformanceMonitor _monitor;

    public MetricsCollector(BabelReporting reporting, string userKey)
    {
        _reporting = reporting;
        _monitor = new PerformanceMonitor();

        // Report metrics every hour
        _timer = new Timer(async _ =>
        {
            var metrics = _monitor.GetCurrentMetrics();
            var report = new PerformanceMetricsReport
            {
                AverageResponseTime = metrics.AvgResponseTime,
                PeakResponseTime = metrics.PeakResponseTime,
                TotalRequests = metrics.TotalRequests,
                FailedRequests = metrics.FailedRequests,
                CpuUsage = metrics.CpuUsage,
                MemoryUsage = metrics.MemoryUsage,
                Uptime = metrics.Uptime
            };

            await _reporting.SendAsync(userKey, report);
        }, null, TimeSpan.FromHours(1), TimeSpan.FromHours(1));
    }
}
例 3:ビジネスイベントレポート
重要なビジネスイベントを追跡します。
public class BusinessEventReport : Report
{
    public string EventCategory { get; set; }
    public string EventAction { get; set; }
    public string UserId { get; set; }
    public string EntityType { get; set; }
    public string EntityId { get; set; }
    public decimal? TransactionAmount { get; set; }
    public Dictionary<string, object> Metadata { get; set; }

    public BusinessEventReport() : base("BusinessEvent")
    {
        Metadata = new Dictionary<string, object>();
    }

    public override void Build()
    {
        Properties.Add("event_category", EventCategory);
        Properties.Add("event_action", EventAction);
        Properties.Add("user_id", UserId);
        Properties.Add("entity_type", EntityType);
        Properties.Add("entity_id", EntityId);
        Properties.Add("timestamp", DateTime.UtcNow);

        if (TransactionAmount.HasValue)
        {
            Properties.Add("transaction_amount", TransactionAmount.Value);
        }

        // Add metadata
        foreach (var kvp in Metadata)
        {
            Properties.Add(kvp.Key, kvp.Value);
        }

        base.Build();
    }
}

// Usage
public async Task ReportPurchase(string userId, string orderId, decimal amount)
{
    var report = new BusinessEventReport
    {
        EventCategory = "Sales",
        EventAction = "Purchase",
        UserId = userId,
        EntityType = "Order",
        EntityId = orderId,
        TransactionAmount = amount
    };

    report.Metadata.Add("payment_method", "CreditCard");
    report.Metadata.Add("currency", "USD");

    await _reporting.SendAsync(_userKey, report);
}
例 4:診断レポート
詳細な診断情報を送信します。
public class DiagnosticReport : Report
{
    public string Component { get; set; }
    public string Status { get; set; }
    public string ErrorMessage { get; set; }
    public Dictionary<string, string> ConfigurationSettings { get; set; }
    public Dictionary<string, string> HealthChecks { get; set; }

    public DiagnosticReport() : base("Diagnostic")
    {
        ConfigurationSettings = new Dictionary<string, string>();
        HealthChecks = new Dictionary<string, string>();
    }

    public override void Build()
    {
        Properties.Add("component", Component);
        Properties.Add("status", Status);
        Properties.Add("error_message", ErrorMessage ?? "None");
        Properties.Add("timestamp", DateTime.UtcNow);
        Properties.Add("application_version", GetApplicationVersion());

        // Add configuration settings
        var configJson = JsonSerializer.Serialize(ConfigurationSettings);
        Properties.Add("configuration", configJson);

        // Add health check results
        var healthJson = JsonSerializer.Serialize(HealthChecks);
        Properties.Add("health_checks", healthJson);

        base.Build();
    }

    private string GetApplicationVersion()
    {
        return Assembly.GetExecutingAssembly().GetName().Version.ToString();
    }
}

// Usage
public async Task ReportDatabaseConnectionIssue()
{
    var report = new DiagnosticReport
    {
        Component = "Database",
        Status = "Error",
        ErrorMessage = "Connection timeout after 30 seconds"
    };

    report.ConfigurationSettings.Add("connection_string", "Server=***;Database=***");
    report.ConfigurationSettings.Add("timeout", "30");
    report.ConfigurationSettings.Add("retry_count", "3");

    report.HealthChecks.Add("database_ping", "Failed");
    report.HealthChecks.Add("dns_resolution", "Success");
    report.HealthChecks.Add("network_connectivity", "Success");

    await _reporting.SendAsync(_userKey, report);
}
環境情報とシステム情報の追加
組み込みのコレクターを使用すると、カスタムレポートに環境情報とシステム情報を追加できます。
using Babel.Licensing.Reports;
using Babel.Licensing.Reports.Collectors;

public class EnhancedCustomReport : Report
{
    private readonly EnvironmentReportOptions _envOptions;
    private readonly SystemReportOptions _sysOptions;

    public string CustomData { get; set; }

    public EnhancedCustomReport() : base("EnhancedCustom")
    {
        // Configure what environment/system info to collect
        _envOptions = new EnvironmentReportOptions
        {
            CollectApplicationInformation = true,
            CollectLoadedAssemblies = true,
            CollectEnvironmentVariables = false
        };

        _sysOptions = new SystemReportOptions
        {
            CollectOsInformation = true,
            CollectProcessorInformation = true,
            CollectMemoryInformation = true
        };
    }

    public override void Build()
    {
        // Add your custom properties
        Properties.Add("custom_data", CustomData);

        // Add environment information
        var envCollector = new EnvironmentCollector(Properties, _envOptions);
        envCollector.Collect();

        // Add system information
        var sysCollector = new SystemCollector(Properties, _sysOptions);
        sysCollector.Collect();

        base.Build();
    }
}
レポートへのチャートの追加
カスタムレポートには、Babel Licensing の Web アプリケーションで自動的に描画されるインタラクティブなチャートを含められます。ReportPlot クラスを使用して、レポートデータを視覚化します。
チャートの種類
ReportPlotType 列挙型は、4 種類のチャートをサポートしています。
- Pie:分布データを円グラフで表示します
- Line:時間の経過に伴う傾向を折れ線グラフで示します
- Bar:カテゴリ別のデータを棒グラフで比較します
- Area:累積データを面グラフで視覚化します
円グラフの作成
円グラフは、カテゴリの分布を示すのに適しています。
using Babel.Licensing.Reports;

// Create a pie chart for attack type distribution
var attackDistribution = new ReportPlot(ReportPlotType.Pie, "Attack Type Distribution")
    .SetHeight(400)
    .AddSeries("Attacks", new List<object>
    {
        new { type = "SQL Injection", count = 45 },
        new { type = "XSS", count = 32 },
        new { type = "CSRF", count = 18 },
        new { type = "Path Traversal", count = 12 },
        new { type = "Brute Force", count = 8 }
    });

// Configure which fields to use for the chart
attackDistribution.Series[0].ArgumentField = "type";  // Category labels
attackDistribution.Series[0].ValueField = "count";    // Values

// Add to report properties
Properties.Add("attackDistribution", attackDistribution.ToDictionary());
折れ線グラフの作成
折れ線グラフは、時間の経過に伴う傾向を示すのに最適です。
// Create a line chart comparing attack attempts over time
var attackTimeline = new ReportPlot(ReportPlotType.Line, "Attack Attempts Over Time")
    .SetAxisTitles("Time", "Attack Count")
    .SetHeight(350)
    .AddSeries("Today", new List<object>
    {
        new { hour = "00:00", attempts = 5 },
        new { hour = "04:00", attempts = 3 },
        new { hour = "08:00", attempts = 15 },
        new { hour = "12:00", attempts = 28 },
        new { hour = "16:00", attempts = 22 },
        new { hour = "20:00", attempts = 18 }
    })
    .AddSeries("Yesterday", new List<object>
    {
        new { hour = "00:00", attempts = 4 },
        new { hour = "04:00", attempts = 2 },
        new { hour = "08:00", attempts = 12 },
        new { hour = "12:00", attempts = 20 },
        new { hour = "16:00", attempts = 25 },
        new { hour = "20:00", attempts = 15 }
    });

// Configure field mappings for each series
attackTimeline.Series[0].ArgumentField = "hour";
attackTimeline.Series[0].ValueField = "attempts";
attackTimeline.Series[1].ArgumentField = "hour";
attackTimeline.Series[1].ValueField = "attempts";

Properties.Add("attackTimeline", attackTimeline.ToDictionary());
棒グラフの作成
棒グラフは、個別のカテゴリを比較するのに向いています。
// Create a bar chart for severity levels
var severityChart = new ReportPlot(ReportPlotType.Bar, "Attack Severity Levels")
    .SetAxisTitles("Severity", "Incidents")
    .SetHeight(350)
    .AddSeries("Last 24h", new List<object>
    {
        new { severity = "Critical", incidents = 8 },
        new { severity = "High", incidents = 25 },
        new { severity = "Medium", incidents = 42 },
        new { severity = "Low", incidents = 30 }
    });

severityChart.Series[0].ArgumentField = "severity";
severityChart.Series[0].ValueField = "incidents";

Properties.Add("severityChart", severityChart.ToDictionary());
面グラフの作成
面グラフは、複数の系列にわたる累積データを示すのに役立ちます。
// Create an area chart for attack sources by region
var ipSourceChart = new ReportPlot(ReportPlotType.Area, "Attack Sources by Region")
    .SetAxisTitles("Hour", "Unique IPs")
    .SetHeight(350)
    .AddSeries("Asia", new List<object>
    {
        new { hour = "00:00", ips = 12 },
        new { hour = "06:00", ips = 18 },
        new { hour = "12:00", ips = 25 },
        new { hour = "18:00", ips = 22 }
    })
    .AddSeries("Europe", new List<object>
    {
        new { hour = "00:00", ips = 8 },
        new { hour = "06:00", ips = 15 },
        new { hour = "12:00", ips = 20 },
        new { hour = "18:00", ips = 18 }
    })
    .AddSeries("Americas", new List<object>
    {
        new { hour = "00:00", ips = 5 },
        new { hour = "06:00", ips = 10 },
        new { hour = "12:00", ips = 15 },
        new { hour = "18:00", ips = 12 }
    });

// Configure field mappings for all series
foreach (var series in ipSourceChart.Series)
{
    series.ArgumentField = "hour";
    series.ValueField = "ips";
}

Properties.Add("ipSourceChart", ipSourceChart.ToDictionary());
ReportPlot API リファレンス
コンストラクター
new ReportPlot(ReportPlotType type, string title)メソッド
| メソッド | 説明 |
|---|---|
SetHeight(int height) | チャートの高さをピクセル単位で設定します |
SetAxisTitles(string xAxis, string yAxis) | X 軸と Y 軸のラベルを設定します |
AddSeries(string name, List<object> data) | チャートにデータ系列を追加します |
ToDictionary() | チャートを、レポートのプロパティに追加するディクショナリに変換します |
系列のプロパティ
| プロパティ | 説明 |
|---|---|
ArgumentField | X 軸の値(カテゴリ)として使用する、データオブジェクト内のフィールド名 |
ValueField | Y 軸の値(測定値)として使用する、データオブジェクト内のフィールド名 |
複数のチャートを含む完全な例
複数の視覚化を含む、完全なカスタムレポートクラスを次に示します。
public class SecurityDashboardReport : Report
{
    public SecurityDashboardReport() : base("SecurityDashboard") { }

    public override void Build()
    {
        // Basic properties
        Properties.Add("generated_at", DateTime.UtcNow);
        Properties.Add("machine_name", Environment.MachineName);

        // Pie chart: Attack distribution
        var attackTypes = new ReportPlot(ReportPlotType.Pie, "Attack Types")
            .SetHeight(400)
            .AddSeries("Types", GetAttackTypeData());
        attackTypes.Series[0].ArgumentField = "type";
        attackTypes.Series[0].ValueField = "count";
        Properties.Add("attackTypes", attackTypes.ToDictionary());

        // Line chart: Attacks over time
        var timeline = new ReportPlot(ReportPlotType.Line, "Attack Timeline")
            .SetAxisTitles("Time", "Attacks")
            .SetHeight(350)
            .AddSeries("Attacks", GetTimelineData());
        timeline.Series[0].ArgumentField = "time";
        timeline.Series[0].ValueField = "count";
        Properties.Add("timeline", timeline.ToDictionary());

        // Bar chart: Severity breakdown
        var severity = new ReportPlot(ReportPlotType.Bar, "Severity Distribution")
            .SetAxisTitles("Level", "Count")
            .SetHeight(350)
            .AddSeries("Severity", GetSeverityData());
        severity.Series[0].ArgumentField = "level";
        severity.Series[0].ValueField = "count";
        Properties.Add("severity", severity.ToDictionary());

        base.Build();
    }

    private List<object> GetAttackTypeData() => new List<object>
    {
        new { type = "SQL Injection", count = 45 },
        new { type = "XSS", count = 32 },
        new { type = "CSRF", count = 18 }
    };

    private List<object> GetTimelineData() => new List<object>
    {
        new { time = "08:00", count = 15 },
        new { time = "12:00", count = 28 },
        new { time = "16:00", count = 22 }
    };

    private List<object> GetSeverityData() => new List<object>
    {
        new { level = "Critical", count = 8 },
        new { level = "High", count = 25 },
        new { level = "Medium", count = 42 }
    };
}
このレポートを Babel Licensing の Web アプリケーションで表示すると、すべてのチャートがインタラクティブな視覚化として描画され、カスタムレポートのデータを視覚的に分析できます。
レポートの暗号化
カスタムレポート内の機密データを、暗号化で保護します。
var reporting = new BabelReporting();
reporting.Configuration.EncryptionKey = "your-secret-encryption-key";

var report = new SecurityEventReport
{
    EventType = "DataBreach",
    Severity = "Critical",
    // ... sensitive data
};

// Report will be automatically encrypted before transmission
var result = await reporting.SendAsync(userKey, report);
サーバーがレポートを復号するには、サーバーにも同じ暗号化キーを設定しておく必要があります。
送信前のカスタマイズ
任意のレポート(カスタムレポートを含む)を、送信前に変更します。
reporting.BeforeSendReport += (s, e) =>
{
    // Add global properties to all reports
    e.Report.Properties.Add("environment", "production");
    e.Report.Properties.Add("region", "us-east-1");
    e.Report.Properties.Add("deployment_id", DeploymentId);

    // Add conditional logic
    if (e.Report.Name == "SecurityEvent")
    {
        e.Report.Properties.Add("security_version", SecurityFrameworkVersion);
    }

    // Validate before sending
    if (!IsValidReport(e.Report))
    {
        e.Cancel = true;  // Don't send invalid reports
    }
};
レポートの構造
すべてのレポートは、一貫した JSON 構造に従います。
{
  "name": "HackDetection",
  "version": "1.0",
  "date": "2025-01-22T10:30:00Z",
  "encrypted": false,
  "content": {
    "properties": {
      "machine_name": "DESKTOP-ABC123",
      "hacking_type": "SQL Injection",
      "attack_method": "Malicious Input",
      "detection_details": "Detected SQL keywords in user input",
      "detected_at": "2025-01-22T10:30:00Z"
    }
  }
}
サーバー側の処理
カスタムレポートが Babel Licensing Service に届くと、次の処理が行われます。
- 検証:レポートの名前と内容が検証されます
- 復号:暗号化された内容が、設定されたキーで復号されます
- 解析:内容からプロパティが抽出されます
- 保存:レポートがメタデータとともにデータベースに保存されます
- インデックス作成:検索できるように、プロパティのインデックスが作成されます
- Webhook:外部連携のために
ReportCreatedイベントが送出されます
カスタムレポートは、Babel Licensing Service の API でクエリを実行できます。
GET /api/reports?name=HackDetection&from=2025-01-01&to=2025-01-31ベストプラクティス
1. わかりやすいレポート名を選ぶ
レポートの種類には、内容がわかる一貫した名前を使用します。
// GOOD: Clear and specific
public class UserAuthenticationFailureReport : Report
{
    public UserAuthenticationFailureReport() : base("UserAuthFailure") { }
}

// BAD: Generic and unclear
public class CustomReport1 : Report
{
    public CustomReport1() : base("Report1") { }
}
2. タイムスタンプを含める
時系列で分析できるように、必ずタイムスタンプを含めます。
public override void Build()
{
    Properties.Add("timestamp", DateTime.UtcNow);
    Properties.Add("event_time", eventOccurredAt);
    base.Build();
}
3. コンテキスト情報を追加する
レポートを基に対応できるように、十分なコンテキストを含めます。
Properties.Add("user_id", userId);
Properties.Add("session_id", sessionId);
Properties.Add("request_id", requestId);
Properties.Add("correlation_id", correlationId);
4. 構造化データを使用する
分析しやすくするために、自由形式のテキストよりも構造化データを優先します。
// GOOD: Structured
Properties.Add("response_time_ms", 1250);
Properties.Add("status_code", 200);
Properties.Add("endpoint", "/api/users");

// BAD: Unstructured
Properties.Add("message", "Request to /api/users took 1250ms and returned 200");
5. エラーを適切に処理する
レポートの失敗がアプリケーションの機能に影響しないようにします。
try
{
    var report = new CustomReport { /* ... */ };
    await _reporting.SendAsync(_userKey, report);
}
catch (Exception ex)
{
    // Log error but don't throw
    _logger.LogWarning(ex, "Failed to send custom report");
}
6. 関連するイベントをまとめる
個別のレポートを多数送信するのではなく、関連するイベントをまとめて送信します。
public class BatchEventReport : Report
{
    public List<EventData> Events { get; set; } = new List<EventData>();

    public BatchEventReport() : base("BatchEvent") { }

    public override void Build()
    {
        Properties.Add("event_count", Events.Count);
        Properties.Add("events", JsonSerializer.Serialize(Events));
        Properties.Add("batch_time", DateTime.UtcNow);
        base.Build();
    }
}
7. 機密データをサニタイズする
パスワード、API キー、個人を特定できる情報は、決して含めないでください。
public override void Build()
{
    // GOOD: Sanitized
    Properties.Add("username", SanitizeUsername(username));
    Properties.Add("email", HashEmail(email));

    // BAD: Sensitive data
    // Properties.Add("password", password);  // NEVER DO THIS
    // Properties.Add("credit_card", cardNumber);  // NEVER DO THIS

    base.Build();
}

private string SanitizeUsername(string username)
{
    // Return first 3 chars + asterisks
    if (username.Length <= 3) return "***";
    return username.Substring(0, 3) + new string('*', username.Length - 3);
}
完全な例
カスタムレポートを、適切なエラー処理および構成と組み合わせた完全な例を次に示します。
using Babel.Licensing.Reports;
using Babel.Licensing.Services;
using Microsoft.Extensions.Logging;

public class ApplicationReportingService
{
    private readonly BabelReporting _reporting;
    private readonly ILogger<ApplicationReportingService> _logger;
    private readonly string _userKey;

    public ApplicationReportingService(
        IConfiguration configuration,
        ILogger<ApplicationReportingService> logger)
    {
        _logger = logger;
        _userKey = configuration["Licensing:UserKey"];

        _reporting = new BabelReporting();
        _reporting.Configuration.ServiceUrl = configuration["Licensing:ServiceUrl"];
        _reporting.Configuration.ClientId = "EquiTrack v2.0";
        _reporting.Configuration.EncryptionKey = configuration["Licensing:EncryptionKey"];

        _reporting.BeforeSendReport += OnBeforeSendReport;
        _reporting.AfterSendReport += OnAfterSendReport;
    }

    private void OnBeforeSendReport(object sender, BeforeSendReportEventArgs e)
    {
        // Add global context to all reports
        e.Report.Properties["application_version"] = GetApplicationVersion();
        e.Report.Properties["environment"] = GetEnvironment();
    }

    private void OnAfterSendReport(object sender, AfterSendReportEventArgs e)
    {
        if (e.Error != null)
        {
            _logger.LogError(e.Error, "Failed to send {ReportType} report", e.Report.Name);
        }
        else
        {
            _logger.LogInformation("Sent {ReportType} report: {ReportId}",
                e.Report.Name, e.Result.ReportUid);
        }
    }

    public async Task ReportSecurityEvent(
        string eventType,
        string severity,
        string details)
    {
        try
        {
            var report = new SecurityEventReport
            {
                EventType = eventType,
                Severity = severity,
                SourceIP = GetClientIpAddress(),
                UserAgent = GetUserAgent(),
                RequestPath = GetCurrentRequestPath()
            };

            report.AdditionalData["details"] = details;

            var result = await _reporting.SendAsync(_userKey, report);

            if (!result.Success)
            {
                _logger.LogWarning("Security event report failed: {Error}",
                    result.Error?.Message);
            }
        }
        catch (Exception ex)
        {
            _logger.LogError(ex, "Exception sending security event report");
        }
    }

    private string GetApplicationVersion() =>
        Assembly.GetExecutingAssembly().GetName().Version.ToString();

    private string GetEnvironment() =>
        Environment.GetEnvironmentVariable("ASPNETCORE_ENVIRONMENT") ?? "Production";

    private string GetClientIpAddress() => /* implementation */;
    private string GetUserAgent() => /* implementation */;
    private string GetCurrentRequestPath() => /* implementation */;
}
関連項目
- 例外レポート:組み込みの例外レポート機能
- ライセンス使用状況レポート:ライセンスの使用状況を追跡する
- フローティングライセンス:レポート用のユーザーキーを生成する