Report personalizzati
Oltre ai report di eccezione e di licenza integrati, Babel Licensing ti permette di creare report personalizzati, adattati alle esigenze specifiche della tua applicazione. Con i report personalizzati puoi inviare al tuo Babel Licensing Service qualsiasi dato strutturato, per raccoglierlo, analizzarlo e monitorarlo in modo centralizzato.
Panoramica
I report personalizzati sono utili per:
- Eventi di sicurezza: rilevare e segnalare potenziali tentativi di attacco, accessi non autorizzati o comportamenti sospetti
- Metriche dell’applicazione: tracciare metriche personalizzate sulle prestazioni o sull’utilizzo dell’applicazione
- Eventi di business: segnalare eventi o traguardi di business significativi
- Diagnostica: inviare dati diagnostici personalizzati per la risoluzione dei problemi
- Tracce di audit: creare log di audit per i requisiti di conformità
Esempio di applicazione console
Per iniziare con un esempio pratico, clona il repository console-custom-report-example, che mostra come creare e inviare report personalizzati con le funzionalità di Babel Reporting.
Apri un client Git
Apri il client Git che preferisci o la riga di comando.
Clona il repository
Clona il repository GitHub eseguendo il comando seguente:
git clone https://github.com/babelfornet/console-custom-report-example.gitVai alla cartella del progetto
Una volta clonato il repository, vai alla cartella del progetto:
cd console-custom-report-exampleEsplora ed esegui l’esempio
Ora puoi esplorare ed eseguire il codice di esempio.
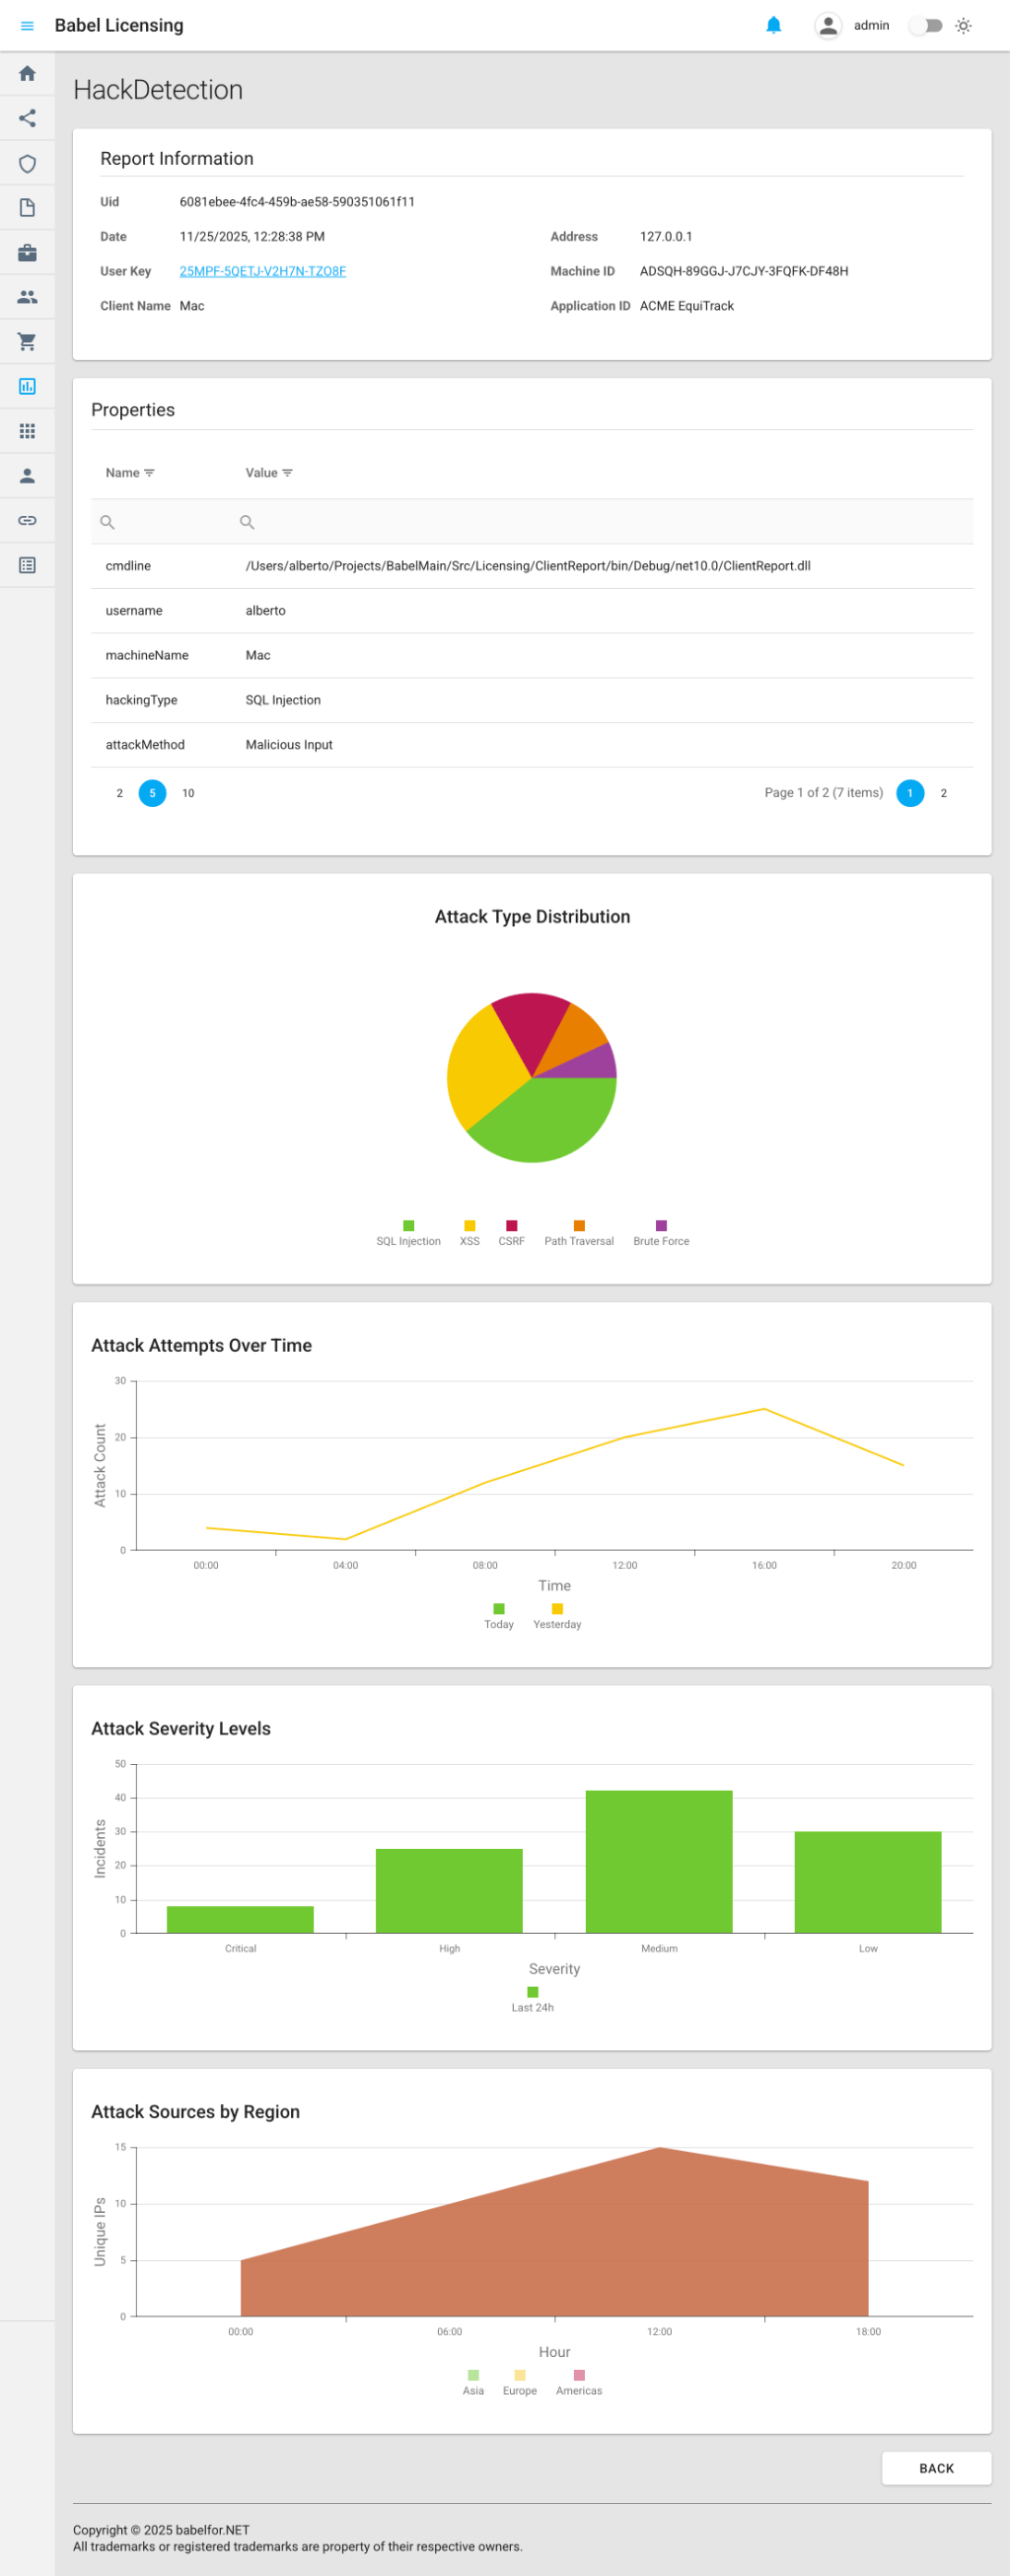
console-custom-report-example mostra come integrare la libreria client di Babel Licensing nella tua applicazione per creare report personalizzati e inviarli al Babel Licensing Service. Ecco il codice passo per passo:
- Inizializzazione di BabelReporting: il codice di esempio inizializza un oggetto
BabelReportinge lo configura con l’URL del servizio e l’identificatore del client.
private BabelReporting CreateReportingClient()
{
    var reporting = new BabelReporting();

    reporting.Configuration.ClientId = ClientId;
    reporting.Configuration.ServiceUrl = ServiceUrl;
    reporting.Configuration.UseHttp(http => {
        http.Timeout = TimeSpan.FromSeconds(3);
        http.Handler = new HttpClientHandler() {
            ServerCertificateCustomValidationCallback = (message, cert, chain, errors) => true
        };
    });

    reporting.BeforeSendReport += (s, e) => {
        e.Report.Properties.Add("cmdline", Environment.CommandLine);
        e.Report.Properties.Add("username", Environment.UserName);
    };

    return reporting;
}-
Chiave utente: il codice di esempio usa una chiave utente (
UserKey) per autorizzare il client a inviare i report. Ricorda di sostituirla con una chiave utente valida. Per generare una chiave utente, vedi i paragrafi Licenza flottante o Attivazione della licenza. -
Classe del report personalizzato: la classe
HackDetectionReporteredita daReporte definisce proprietà personalizzate per tracciare gli eventi di sicurezza. UsaReportPlotper creare grafici interattivi, che vengono visualizzati nell’applicazione web:
class HackDetectionReport : Report
{
    public string HackingType { get; set; } = "unknown";
    public string AttackMethod { get; set; } = "unknown";
    public string HackDetails { get; set; } = "no_details";

    public HackDetectionReport() : base("HackDetection") { }

    public override void Build()
    {
        // Add custom hack detection information
        Properties.Add("machineName", Environment.MachineName);
        Properties.Add("hackingType", HackingType);
        Properties.Add("attackMethod", AttackMethod);
        Properties.Add("hackDetails", HackDetails);

        // Add attack distribution pie chart
        var attackDistribution = new ReportPlot(ReportPlotType.Pie, "Attack Type Distribution")
            .SetHeight(400)
            .AddSeries("Attacks", new List<object>
            {
                new { type = "SQL Injection", count = 45 },
                new { type = "XSS", count = 32 },
                new { type = "CSRF", count = 18 },
                new { type = "Path Traversal", count = 12 },
                new { type = "Brute Force", count = 8 }
            });
        attackDistribution.Series[0].ArgumentField = "type";
        attackDistribution.Series[0].ValueField = "count";
        Properties.Add("attackDistribution", attackDistribution.ToDictionary());

        // Add attack timeline line chart
        var attackTimeline = new ReportPlot(ReportPlotType.Line, "Attack Attempts Over Time")
            .SetAxisTitles("Time", "Attack Count")
            .SetHeight(350)
            .AddSeries("Today", new List<object>
            {
                new { hour = "00:00", attempts = 5 },
                new { hour = "04:00", attempts = 3 },
                new { hour = "08:00", attempts = 15 },
                new { hour = "12:00", attempts = 28 },
                new { hour = "16:00", attempts = 22 },
                new { hour = "20:00", attempts = 18 }
            })
            .AddSeries("Yesterday", new List<object>
            {
                new { hour = "00:00", attempts = 4 },
                new { hour = "04:00", attempts = 2 },
                new { hour = "08:00", attempts = 12 },
                new { hour = "12:00", attempts = 20 },
                new { hour = "16:00", attempts = 25 },
                new { hour = "20:00", attempts = 15 }
            });
        attackTimeline.Series[0].ArgumentField = "hour";
        attackTimeline.Series[0].ValueField = "attempts";
        attackTimeline.Series[1].ArgumentField = "hour";
        attackTimeline.Series[1].ValueField = "attempts";
        Properties.Add("attackTimeline", attackTimeline.ToDictionary());

        // Add severity bar chart
        var severityChart = new ReportPlot(ReportPlotType.Bar, "Attack Severity Levels")
            .SetAxisTitles("Severity", "Incidents")
            .SetHeight(350)
            .AddSeries("Last 24h", new List<object>
            {
                new { severity = "Critical", incidents = 8 },
                new { severity = "High", incidents = 25 },
                new { severity = "Medium", incidents = 42 },
                new { severity = "Low", incidents = 30 }
            });
        severityChart.Series[0].ArgumentField = "severity";
        severityChart.Series[0].ValueField = "incidents";
        Properties.Add("severityChart", severityChart.ToDictionary());

        // Add IP source area chart
        var ipSourceChart = new ReportPlot(ReportPlotType.Area, "Attack Sources by Region")
            .SetAxisTitles("Hour", "Unique IPs")
            .SetHeight(350)
            .AddSeries("Asia", new List<object>
            {
                new { hour = "00:00", ips = 12 },
                new { hour = "06:00", ips = 18 },
                new { hour = "12:00", ips = 25 },
                new { hour = "18:00", ips = 22 }
            })
            .AddSeries("Europe", new List<object>
            {
                new { hour = "00:00", ips = 8 },
                new { hour = "06:00", ips = 15 },
                new { hour = "12:00", ips = 20 },
                new { hour = "18:00", ips = 18 }
            })
            .AddSeries("Americas", new List<object>
            {
                new { hour = "00:00", ips = 5 },
                new { hour = "06:00", ips = 10 },
                new { hour = "12:00", ips = 15 },
                new { hour = "18:00", ips = 12 }
            });
        ipSourceChart.Series[0].ArgumentField = "hour";
        ipSourceChart.Series[0].ValueField = "ips";
        ipSourceChart.Series[1].ArgumentField = "hour";
        ipSourceChart.Series[1].ValueField = "ips";
        ipSourceChart.Series[2].ArgumentField = "hour";
        ipSourceChart.Series[2].ValueField = "ips";
        Properties.Add("ipSourceChart", ipSourceChart.ToDictionary());

        base.Build();
    }
}-
Evento BeforeSendReport: l’esempio si sottoscrive all’evento
BeforeSendReport, che ti permette di aggiungere altre proprietà ai report prima dell’invio. In questo gestore dell’evento vengono aggiunte proprietà personalizzate comecmdline(la riga di comando) eusername(il nome dell’utente corrente). -
Invio del report: il metodo
SendAsyncinvia il report personalizzato al Babel Licensing Service:
private async Task SendHackDetectionReportAsync()
{
    var hackReport = new HackDetectionReport
    {
        HackingType = "SQL Injection",
        AttackMethod = "Malicious Input",
        HackDetails = "Detected SQL keywords in user input"
    };
    await _reporting.SendAsync(UserKey, hackReport);
    Console.WriteLine("HackDetectionReport sent.");
}
Esempio di report personalizzato
console-custom-report-example è una dimostrazione pratica di come creare tipi di report personalizzati e inviarli al Babel Licensing Service. Integrando i report personalizzati nelle tue applicazioni puoi tracciare eventi di sicurezza, metriche dell’applicazione, eventi di business e qualsiasi altro dato strutturato rilevante per la tua applicazione.
Creare un report personalizzato
Per creare un report personalizzato, eredita dalla classe base Report:
using Babel.Licensing.Reports;

public class HackDetectionReport : Report
{
    // Custom properties for your report
    public string HackingType { get; set; } = "unknown";
    public string AttackMethod { get; set; } = "unknown";
    public string HackDetails { get; set; } = "no_details";

    // Constructor: specify report name
    public HackDetectionReport() : base("HackDetection")
    {
    }

    // Build method: populate report properties
    public override void Build()
    {
        // Add custom properties to the report
        Properties.Add("machine_name", Environment.MachineName);
        Properties.Add("hacking_type", HackingType);
        Properties.Add("attack_method", AttackMethod);
        Properties.Add("detection_details", HackDetails);
        Properties.Add("detected_at", DateTime.UtcNow);

        // Call base to generate final JSON structure
        base.Build();
    }
}
La classe base Report
La classe Report è la base di tutti i report:
Proprietà principali
- Name: identificatore univoco del tipo di report (per esempio “HackDetection”, “PerformanceMetrics”)
- Content: dati del report serializzati in JSON (generati da
Build()) - Version: versione del formato del report (attualmente “1.0”)
- Date: timestamp di creazione del report
- Encrypted: indicatore che segnala se il contenuto è cifrato
- Properties: dizionario per i dati personalizzati in coppie chiave-valore
Metodi principali
- Build(): esegui l’override di questo metodo per compilare le tue proprietà personalizzate
- Create(string report, string password): deserializza un report dal JSON
- FromException(Exception ex, ExceptionReportOptions options): metodo factory per i report di eccezione
Inviare i report personalizzati
Dopo aver creato la classe del tuo report personalizzato, invialo con BabelReporting:
using Babel.Licensing.Services;

// Initialize reporting service
var reporting = new BabelReporting();
reporting.Configuration.ServiceUrl = "https://licensing.example.com";
reporting.Configuration.ClientId = "MyApplication";

// Create and configure your custom report
var hackReport = new HackDetectionReport
{
    HackingType = "SQL Injection",
    AttackMethod = "Malicious Input",
    HackDetails = "Detected SQL keywords in user input: ' OR '1'='1"
};

// Send the report
var result = await reporting.SendAsync(userKey, hackReport);

if (result.Success)
{
    Console.WriteLine($"Report sent: {result.ReportUid}");
}
else
{
    Console.WriteLine($"Failed: {result.Error?.Message}");
}
Esempi reali
Esempio 1: report di evento di sicurezza
Rileva e segnala le potenziali minacce alla sicurezza:
public class SecurityEventReport : Report
{
    public string EventType { get; set; }
    public string Severity { get; set; }
    public string SourceIP { get; set; }
    public string UserAgent { get; set; }
    public string RequestPath { get; set; }
    public Dictionary<string, string> AdditionalData { get; set; }

    public SecurityEventReport() : base("SecurityEvent")
    {
        AdditionalData = new Dictionary<string, string>();
    }

    public override void Build()
    {
        Properties.Add("event_type", EventType);
        Properties.Add("severity", Severity);
        Properties.Add("source_ip", SourceIP);
        Properties.Add("user_agent", UserAgent);
        Properties.Add("request_path", RequestPath);
        Properties.Add("timestamp", DateTime.UtcNow);
        Properties.Add("machine_id", GetMachineId());

        // Add all additional data
        foreach (var kvp in AdditionalData)
        {
            Properties.Add(kvp.Key, kvp.Value);
        }

        base.Build();
    }

    private string GetMachineId()
    {
        // Implementation to get unique machine identifier
        return Environment.MachineName;
    }
}

// Usage
public async Task ReportSuspiciousLogin(string ipAddress, string userAgent)
{
    var report = new SecurityEventReport
    {
        EventType = "SuspiciousLogin",
        Severity = "High",
        SourceIP = ipAddress,
        UserAgent = userAgent,
        RequestPath = "/api/auth/login"
    };

    report.AdditionalData.Add("failed_attempts", "5");
    report.AdditionalData.Add("time_window", "60s");

    await _reporting.SendAsync(_userKey, report);
}
Esempio 2: report delle metriche di prestazioni
Traccia le metriche delle prestazioni dell’applicazione:
public class PerformanceMetricsReport : Report
{
    public double AverageResponseTime { get; set; }
    public double PeakResponseTime { get; set; }
    public int TotalRequests { get; set; }
    public int FailedRequests { get; set; }
    public double CpuUsage { get; set; }
    public double MemoryUsage { get; set; }
    public TimeSpan Uptime { get; set; }

    public PerformanceMetricsReport() : base("PerformanceMetrics")
    {
    }

    public override void Build()
    {
        Properties.Add("average_response_time_ms", AverageResponseTime);
        Properties.Add("peak_response_time_ms", PeakResponseTime);
        Properties.Add("total_requests", TotalRequests);
        Properties.Add("failed_requests", FailedRequests);
        Properties.Add("error_rate", CalculateErrorRate());
        Properties.Add("cpu_usage_percent", CpuUsage);
        Properties.Add("memory_usage_mb", MemoryUsage);
        Properties.Add("uptime_hours", Uptime.TotalHours);
        Properties.Add("collection_time", DateTime.UtcNow);

        base.Build();
    }

    private double CalculateErrorRate()
    {
        if (TotalRequests == 0) return 0;
        return (double)FailedRequests / TotalRequests * 100;
    }
}

// Usage with periodic reporting
public class MetricsCollector
{
    private readonly BabelReporting _reporting;
    private readonly Timer _timer;
    private readonly PerformanceMonitor _monitor;

    public MetricsCollector(BabelReporting reporting, string userKey)
    {
        _reporting = reporting;
        _monitor = new PerformanceMonitor();

        // Report metrics every hour
        _timer = new Timer(async _ =>
        {
            var metrics = _monitor.GetCurrentMetrics();
            var report = new PerformanceMetricsReport
            {
                AverageResponseTime = metrics.AvgResponseTime,
                PeakResponseTime = metrics.PeakResponseTime,
                TotalRequests = metrics.TotalRequests,
                FailedRequests = metrics.FailedRequests,
                CpuUsage = metrics.CpuUsage,
                MemoryUsage = metrics.MemoryUsage,
                Uptime = metrics.Uptime
            };

            await _reporting.SendAsync(userKey, report);
        }, null, TimeSpan.FromHours(1), TimeSpan.FromHours(1));
    }
}
Esempio 3: report di evento di business
Traccia gli eventi di business importanti:
public class BusinessEventReport : Report
{
    public string EventCategory { get; set; }
    public string EventAction { get; set; }
    public string UserId { get; set; }
    public string EntityType { get; set; }
    public string EntityId { get; set; }
    public decimal? TransactionAmount { get; set; }
    public Dictionary<string, object> Metadata { get; set; }

    public BusinessEventReport() : base("BusinessEvent")
    {
        Metadata = new Dictionary<string, object>();
    }

    public override void Build()
    {
        Properties.Add("event_category", EventCategory);
        Properties.Add("event_action", EventAction);
        Properties.Add("user_id", UserId);
        Properties.Add("entity_type", EntityType);
        Properties.Add("entity_id", EntityId);
        Properties.Add("timestamp", DateTime.UtcNow);

        if (TransactionAmount.HasValue)
        {
            Properties.Add("transaction_amount", TransactionAmount.Value);
        }

        // Add metadata
        foreach (var kvp in Metadata)
        {
            Properties.Add(kvp.Key, kvp.Value);
        }

        base.Build();
    }
}

// Usage
public async Task ReportPurchase(string userId, string orderId, decimal amount)
{
    var report = new BusinessEventReport
    {
        EventCategory = "Sales",
        EventAction = "Purchase",
        UserId = userId,
        EntityType = "Order",
        EntityId = orderId,
        TransactionAmount = amount
    };

    report.Metadata.Add("payment_method", "CreditCard");
    report.Metadata.Add("currency", "USD");

    await _reporting.SendAsync(_userKey, report);
}
Esempio 4: report diagnostico
Invia informazioni diagnostiche dettagliate:
public class DiagnosticReport : Report
{
    public string Component { get; set; }
    public string Status { get; set; }
    public string ErrorMessage { get; set; }
    public Dictionary<string, string> ConfigurationSettings { get; set; }
    public Dictionary<string, string> HealthChecks { get; set; }

    public DiagnosticReport() : base("Diagnostic")
    {
        ConfigurationSettings = new Dictionary<string, string>();
        HealthChecks = new Dictionary<string, string>();
    }

    public override void Build()
    {
        Properties.Add("component", Component);
        Properties.Add("status", Status);
        Properties.Add("error_message", ErrorMessage ?? "None");
        Properties.Add("timestamp", DateTime.UtcNow);
        Properties.Add("application_version", GetApplicationVersion());

        // Add configuration settings
        var configJson = JsonSerializer.Serialize(ConfigurationSettings);
        Properties.Add("configuration", configJson);

        // Add health check results
        var healthJson = JsonSerializer.Serialize(HealthChecks);
        Properties.Add("health_checks", healthJson);

        base.Build();
    }

    private string GetApplicationVersion()
    {
        return Assembly.GetExecutingAssembly().GetName().Version.ToString();
    }
}

// Usage
public async Task ReportDatabaseConnectionIssue()
{
    var report = new DiagnosticReport
    {
        Component = "Database",
        Status = "Error",
        ErrorMessage = "Connection timeout after 30 seconds"
    };

    report.ConfigurationSettings.Add("connection_string", "Server=***;Database=***");
    report.ConfigurationSettings.Add("timeout", "30");
    report.ConfigurationSettings.Add("retry_count", "3");

    report.HealthChecks.Add("database_ping", "Failed");
    report.HealthChecks.Add("dns_resolution", "Success");
    report.HealthChecks.Add("network_connectivity", "Success");

    await _reporting.SendAsync(_userKey, report);
}
Aggiungere le informazioni sull’ambiente e di sistema
Puoi arricchire i tuoi report personalizzati con le informazioni sull’ambiente e di sistema usando i raccoglitori integrati:
using Babel.Licensing.Reports;
using Babel.Licensing.Reports.Collectors;

public class EnhancedCustomReport : Report
{
    private readonly EnvironmentReportOptions _envOptions;
    private readonly SystemReportOptions _sysOptions;

    public string CustomData { get; set; }

    public EnhancedCustomReport() : base("EnhancedCustom")
    {
        // Configure what environment/system info to collect
        _envOptions = new EnvironmentReportOptions
        {
            CollectApplicationInformation = true,
            CollectLoadedAssemblies = true,
            CollectEnvironmentVariables = false
        };

        _sysOptions = new SystemReportOptions
        {
            CollectOsInformation = true,
            CollectProcessorInformation = true,
            CollectMemoryInformation = true
        };
    }

    public override void Build()
    {
        // Add your custom properties
        Properties.Add("custom_data", CustomData);

        // Add environment information
        var envCollector = new EnvironmentCollector(Properties, _envOptions);
        envCollector.Collect();

        // Add system information
        var sysCollector = new SystemCollector(Properties, _sysOptions);
        sysCollector.Collect();

        base.Build();
    }
}
Aggiungere grafici ai report
I report personalizzati possono contenere grafici interattivi, che l’applicazione web di Babel Licensing visualizza automaticamente. Usa la classe ReportPlot per creare visualizzazioni dei dati del tuo report.
Tipi di grafico
L’enumerazione ReportPlotType supporta quattro tipi di grafico:
- Pie: mostra i dati di distribuzione come grafico a torta
- Line: mostra le tendenze nel tempo con grafici a linee
- Bar: confronta i dati per categoria con grafici a barre
- Area: visualizza i dati cumulativi con grafici ad area
Creare un grafico a torta
I grafici a torta sono ideali per mostrare la distribuzione tra categorie:
using Babel.Licensing.Reports;

// Create a pie chart for attack type distribution
var attackDistribution = new ReportPlot(ReportPlotType.Pie, "Attack Type Distribution")
    .SetHeight(400)
    .AddSeries("Attacks", new List<object>
    {
        new { type = "SQL Injection", count = 45 },
        new { type = "XSS", count = 32 },
        new { type = "CSRF", count = 18 },
        new { type = "Path Traversal", count = 12 },
        new { type = "Brute Force", count = 8 }
    });

// Configure which fields to use for the chart
attackDistribution.Series[0].ArgumentField = "type";  // Category labels
attackDistribution.Series[0].ValueField = "count";    // Values

// Add to report properties
Properties.Add("attackDistribution", attackDistribution.ToDictionary());
Creare un grafico a linee
I grafici a linee sono adatti a mostrare le tendenze nel tempo:
// Create a line chart comparing attack attempts over time
var attackTimeline = new ReportPlot(ReportPlotType.Line, "Attack Attempts Over Time")
    .SetAxisTitles("Time", "Attack Count")
    .SetHeight(350)
    .AddSeries("Today", new List<object>
    {
        new { hour = "00:00", attempts = 5 },
        new { hour = "04:00", attempts = 3 },
        new { hour = "08:00", attempts = 15 },
        new { hour = "12:00", attempts = 28 },
        new { hour = "16:00", attempts = 22 },
        new { hour = "20:00", attempts = 18 }
    })
    .AddSeries("Yesterday", new List<object>
    {
        new { hour = "00:00", attempts = 4 },
        new { hour = "04:00", attempts = 2 },
        new { hour = "08:00", attempts = 12 },
        new { hour = "12:00", attempts = 20 },
        new { hour = "16:00", attempts = 25 },
        new { hour = "20:00", attempts = 15 }
    });

// Configure field mappings for each series
attackTimeline.Series[0].ArgumentField = "hour";
attackTimeline.Series[0].ValueField = "attempts";
attackTimeline.Series[1].ArgumentField = "hour";
attackTimeline.Series[1].ValueField = "attempts";

Properties.Add("attackTimeline", attackTimeline.ToDictionary());
Creare un grafico a barre
I grafici a barre funzionano bene per confrontare categorie distinte:
// Create a bar chart for severity levels
var severityChart = new ReportPlot(ReportPlotType.Bar, "Attack Severity Levels")
    .SetAxisTitles("Severity", "Incidents")
    .SetHeight(350)
    .AddSeries("Last 24h", new List<object>
    {
        new { severity = "Critical", incidents = 8 },
        new { severity = "High", incidents = 25 },
        new { severity = "Medium", incidents = 42 },
        new { severity = "Low", incidents = 30 }
    });

severityChart.Series[0].ArgumentField = "severity";
severityChart.Series[0].ValueField = "incidents";

Properties.Add("severityChart", severityChart.ToDictionary());
Creare un grafico ad area
I grafici ad area sono utili per mostrare dati cumulativi su più serie:
// Create an area chart for attack sources by region
var ipSourceChart = new ReportPlot(ReportPlotType.Area, "Attack Sources by Region")
    .SetAxisTitles("Hour", "Unique IPs")
    .SetHeight(350)
    .AddSeries("Asia", new List<object>
    {
        new { hour = "00:00", ips = 12 },
        new { hour = "06:00", ips = 18 },
        new { hour = "12:00", ips = 25 },
        new { hour = "18:00", ips = 22 }
    })
    .AddSeries("Europe", new List<object>
    {
        new { hour = "00:00", ips = 8 },
        new { hour = "06:00", ips = 15 },
        new { hour = "12:00", ips = 20 },
        new { hour = "18:00", ips = 18 }
    })
    .AddSeries("Americas", new List<object>
    {
        new { hour = "00:00", ips = 5 },
        new { hour = "06:00", ips = 10 },
        new { hour = "12:00", ips = 15 },
        new { hour = "18:00", ips = 12 }
    });

// Configure field mappings for all series
foreach (var series in ipSourceChart.Series)
{
    series.ArgumentField = "hour";
    series.ValueField = "ips";
}

Properties.Add("ipSourceChart", ipSourceChart.ToDictionary());
Riferimento API di ReportPlot
Costruttore
new ReportPlot(ReportPlotType type, string title)Metodi
| Metodo | Descrizione |
|---|---|
SetHeight(int height) | Imposta l’altezza del grafico in pixel |
SetAxisTitles(string xAxis, string yAxis) | Imposta le etichette degli assi X e Y |
AddSeries(string name, List<object> data) | Aggiunge una serie di dati al grafico |
ToDictionary() | Converte il grafico in un dizionario per le proprietà del report |
Proprietà delle serie
| Proprietà | Descrizione |
|---|---|
ArgumentField | Il nome del campo degli oggetti dati da usare per i valori dell’asse X (categorie) |
ValueField | Il nome del campo degli oggetti dati da usare per i valori dell’asse Y (misure) |
Esempio completo con più grafici
Ecco una classe completa di report personalizzato che contiene più visualizzazioni:
public class SecurityDashboardReport : Report
{
    public SecurityDashboardReport() : base("SecurityDashboard") { }

    public override void Build()
    {
        // Basic properties
        Properties.Add("generated_at", DateTime.UtcNow);
        Properties.Add("machine_name", Environment.MachineName);

        // Pie chart: Attack distribution
        var attackTypes = new ReportPlot(ReportPlotType.Pie, "Attack Types")
            .SetHeight(400)
            .AddSeries("Types", GetAttackTypeData());
        attackTypes.Series[0].ArgumentField = "type";
        attackTypes.Series[0].ValueField = "count";
        Properties.Add("attackTypes", attackTypes.ToDictionary());

        // Line chart: Attacks over time
        var timeline = new ReportPlot(ReportPlotType.Line, "Attack Timeline")
            .SetAxisTitles("Time", "Attacks")
            .SetHeight(350)
            .AddSeries("Attacks", GetTimelineData());
        timeline.Series[0].ArgumentField = "time";
        timeline.Series[0].ValueField = "count";
        Properties.Add("timeline", timeline.ToDictionary());

        // Bar chart: Severity breakdown
        var severity = new ReportPlot(ReportPlotType.Bar, "Severity Distribution")
            .SetAxisTitles("Level", "Count")
            .SetHeight(350)
            .AddSeries("Severity", GetSeverityData());
        severity.Series[0].ArgumentField = "level";
        severity.Series[0].ValueField = "count";
        Properties.Add("severity", severity.ToDictionary());

        base.Build();
    }

    private List<object> GetAttackTypeData() => new List<object>
    {
        new { type = "SQL Injection", count = 45 },
        new { type = "XSS", count = 32 },
        new { type = "CSRF", count = 18 }
    };

    private List<object> GetTimelineData() => new List<object>
    {
        new { time = "08:00", count = 15 },
        new { time = "12:00", count = 28 },
        new { time = "16:00", count = 22 }
    };

    private List<object> GetSeverityData() => new List<object>
    {
        new { level = "Critical", count = 8 },
        new { level = "High", count = 25 },
        new { level = "Medium", count = 42 }
    };
}
Quando visualizzi questo report nell’applicazione web di Babel Licensing, tutti i grafici vengono mostrati come visualizzazioni interattive, con cui puoi analizzare visivamente i dati del tuo report personalizzato.
Cifratura dei report
Proteggi con la cifratura i dati sensibili dei tuoi report personalizzati:
var reporting = new BabelReporting();
reporting.Configuration.EncryptionKey = "your-secret-encryption-key";

var report = new SecurityEventReport
{
    EventType = "DataBreach",
    Severity = "Critical",
    // ... sensitive data
};

// Report will be automatically encrypted before transmission
var result = await reporting.SendAsync(userKey, report);
Per decifrare il report, il server deve essere configurato con la stessa chiave di cifratura.
Personalizzare prima dell’invio
Modifica qualsiasi report (compresi quelli personalizzati) prima che venga inviato:
reporting.BeforeSendReport += (s, e) =>
{
    // Add global properties to all reports
    e.Report.Properties.Add("environment", "production");
    e.Report.Properties.Add("region", "us-east-1");
    e.Report.Properties.Add("deployment_id", DeploymentId);

    // Add conditional logic
    if (e.Report.Name == "SecurityEvent")
    {
        e.Report.Properties.Add("security_version", SecurityFrameworkVersion);
    }

    // Validate before sending
    if (!IsValidReport(e.Report))
    {
        e.Cancel = true;  // Don't send invalid reports
    }
};
Struttura del report
Tutti i report seguono una struttura JSON uniforme:
{
  "name": "HackDetection",
  "version": "1.0",
  "date": "2025-01-22T10:30:00Z",
  "encrypted": false,
  "content": {
    "properties": {
      "machine_name": "DESKTOP-ABC123",
      "hacking_type": "SQL Injection",
      "attack_method": "Malicious Input",
      "detection_details": "Detected SQL keywords in user input",
      "detected_at": "2025-01-22T10:30:00Z"
    }
  }
}
Elaborazione lato server
Quando il tuo report personalizzato arriva al Babel Licensing Service:
- Convalida: il nome e il contenuto del report vengono convalidati
- Decifratura: il contenuto cifrato viene decifrato con la chiave configurata
- Analisi: le proprietà vengono estratte dal contenuto
- Archiviazione: il report viene salvato nel database con i metadati
- Indicizzazione: le proprietà vengono indicizzate per la ricerca
- Webhook: gli eventi
ReportCreatedvengono inviati per le integrazioni esterne
Puoi interrogare i report personalizzati tramite l’API del Babel Licensing Service:
GET /api/reports?name=HackDetection&from=2025-01-01&to=2025-01-31Procedure consigliate
1. Scegli nomi di report significativi
Usa nomi descrittivi e coerenti per i tuoi tipi di report:
// GOOD: Clear and specific
public class UserAuthenticationFailureReport : Report
{
    public UserAuthenticationFailureReport() : base("UserAuthFailure") { }
}

// BAD: Generic and unclear
public class CustomReport1 : Report
{
    public CustomReport1() : base("Report1") { }
}
2. Includi i timestamp
Includi sempre i timestamp per l’analisi temporale:
public override void Build()
{
    Properties.Add("timestamp", DateTime.UtcNow);
    Properties.Add("event_time", eventOccurredAt);
    base.Build();
}
3. Aggiungi informazioni di contesto
Includi abbastanza contesto perché il report permetta di intervenire:
Properties.Add("user_id", userId);
Properties.Add("session_id", sessionId);
Properties.Add("request_id", requestId);
Properties.Add("correlation_id", correlationId);
4. Usa dati strutturati
Preferisci i dati strutturati al testo libero, per un’analisi migliore:
// GOOD: Structured
Properties.Add("response_time_ms", 1250);
Properties.Add("status_code", 200);
Properties.Add("endpoint", "/api/users");

// BAD: Unstructured
Properties.Add("message", "Request to /api/users took 1250ms and returned 200");
5. Gestisci gli errori in modo controllato
Non lasciare che gli errori di invio dei report incidano sul funzionamento dell’applicazione:
try
{
    var report = new CustomReport { /* ... */ };
    await _reporting.SendAsync(_userKey, report);
}
catch (Exception ex)
{
    // Log error but don't throw
    _logger.LogWarning(ex, "Failed to send custom report");
}
6. Raggruppa gli eventi correlati
Anziché inviare molti report singoli, raggruppa gli eventi correlati:
public class BatchEventReport : Report
{
    public List<EventData> Events { get; set; } = new List<EventData>();

    public BatchEventReport() : base("BatchEvent") { }

    public override void Build()
    {
        Properties.Add("event_count", Events.Count);
        Properties.Add("events", JsonSerializer.Serialize(Events));
        Properties.Add("batch_time", DateTime.UtcNow);
        base.Build();
    }
}
7. Ripulisci i dati sensibili
Non includere mai password, chiavi API o informazioni di identificazione personale:
public override void Build()
{
    // GOOD: Sanitized
    Properties.Add("username", SanitizeUsername(username));
    Properties.Add("email", HashEmail(email));

    // BAD: Sensitive data
    // Properties.Add("password", password);  // NEVER DO THIS
    // Properties.Add("credit_card", cardNumber);  // NEVER DO THIS

    base.Build();
}

private string SanitizeUsername(string username)
{
    // Return first 3 chars + asterisks
    if (username.Length <= 3) return "***";
    return username.Substring(0, 3) + new string('*', username.Length - 3);
}
Esempio completo
Ecco un esempio completo che combina i report personalizzati con una gestione degli errori e una configurazione adeguate:
using Babel.Licensing.Reports;
using Babel.Licensing.Services;
using Microsoft.Extensions.Logging;

public class ApplicationReportingService
{
    private readonly BabelReporting _reporting;
    private readonly ILogger<ApplicationReportingService> _logger;
    private readonly string _userKey;

    public ApplicationReportingService(
        IConfiguration configuration,
        ILogger<ApplicationReportingService> logger)
    {
        _logger = logger;
        _userKey = configuration["Licensing:UserKey"];

        _reporting = new BabelReporting();
        _reporting.Configuration.ServiceUrl = configuration["Licensing:ServiceUrl"];
        _reporting.Configuration.ClientId = "EquiTrack v2.0";
        _reporting.Configuration.EncryptionKey = configuration["Licensing:EncryptionKey"];

        _reporting.BeforeSendReport += OnBeforeSendReport;
        _reporting.AfterSendReport += OnAfterSendReport;
    }

    private void OnBeforeSendReport(object sender, BeforeSendReportEventArgs e)
    {
        // Add global context to all reports
        e.Report.Properties["application_version"] = GetApplicationVersion();
        e.Report.Properties["environment"] = GetEnvironment();
    }

    private void OnAfterSendReport(object sender, AfterSendReportEventArgs e)
    {
        if (e.Error != null)
        {
            _logger.LogError(e.Error, "Failed to send {ReportType} report", e.Report.Name);
        }
        else
        {
            _logger.LogInformation("Sent {ReportType} report: {ReportId}",
                e.Report.Name, e.Result.ReportUid);
        }
    }

    public async Task ReportSecurityEvent(
        string eventType,
        string severity,
        string details)
    {
        try
        {
            var report = new SecurityEventReport
            {
                EventType = eventType,
                Severity = severity,
                SourceIP = GetClientIpAddress(),
                UserAgent = GetUserAgent(),
                RequestPath = GetCurrentRequestPath()
            };

            report.AdditionalData["details"] = details;

            var result = await _reporting.SendAsync(_userKey, report);

            if (!result.Success)
            {
                _logger.LogWarning("Security event report failed: {Error}",
                    result.Error?.Message);
            }
        }
        catch (Exception ex)
        {
            _logger.LogError(ex, "Exception sending security event report");
        }
    }

    private string GetApplicationVersion() =>
        Assembly.GetExecutingAssembly().GetName().Version.ToString();

    private string GetEnvironment() =>
        Environment.GetEnvironmentVariable("ASPNETCORE_ENVIRONMENT") ?? "Production";

    private string GetClientIpAddress() => /* implementation */;
    private string GetUserAgent() => /* implementation */;
    private string GetCurrentRequestPath() => /* implementation */;
}
Argomenti correlati
- Report di eccezione: i report di eccezione integrati
- Report di licenza: traccia l’utilizzo delle licenze
- Licenza flottante: genera le chiavi utente per il reporting